The world has an obesity problem, and the United States has one of the worst — especially compared with other developed nations.
U.S. Adult Obesity Rates by State
Based on CDC data:
- West Virginia stands out with the highest adult obesity rate at 40.1%.
- Louisiana, Oklahoma, Mississippi, Tennessee, Alabama, and Ohio are not far behind, each with rates above 38%.
In contrast:
- The District of Columbia has the lowest rate at 24.3%.
- Colorado, Hawaii, Vermont, Massachusetts, California, and New Jersey all have rates below 30%. Although this may seem high on a global scale, it is comparatively lower within the U.S.
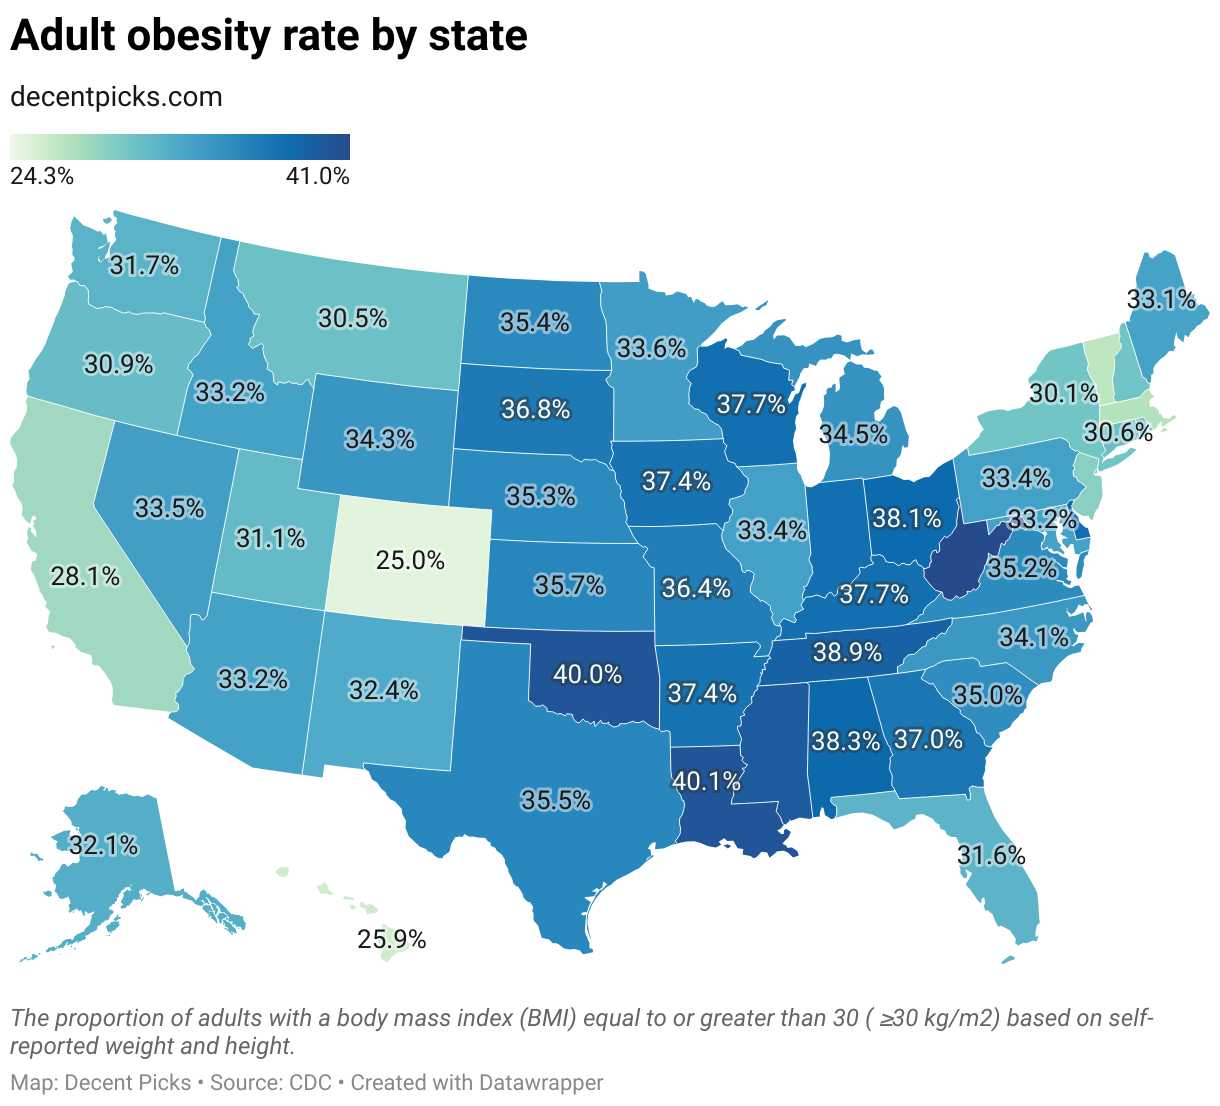
Geographically, southern states tend to have higher obesity rates than Northern ones, and the East Coast generally has higher rates than the West Coast.

Why Does the South Have a Higher Obesity Rate Than the North?
Several factors contribute to the higher obesity rates observed in the Southern United States:
- Socioeconomic Factors: A study examining states like Mississippi, Alabama, Louisiana, Tennessee, and Colorado identified a correlation between increasing Body Mass Index (BMI) and various socioeconomic indicators. Specifically, populations with incomes below the poverty line, dependence on food stamps, and higher unemployment rates, tend to exhibit significantly elevated obesity rates.
- Dietary Habits: The quintessential Southern diet is characteristically rich in fats and fried foods, which can contribute to weight gain when consumed in excess.
- Demographic Considerations: The South has a significant proportion of its population residing in rural areas, as well as a substantial number of African-American women. Both of these groups historically display higher obesity rates.
- Health Complications: The South registers elevated mortality rates from conditions like heart disease and strokes. These health challenges, often associated with obesity, suggest a cyclical relationship where obesity leads to health issues, which in turn can exacerbate obesity-related challenges due to decreased mobility or increased medical complications.

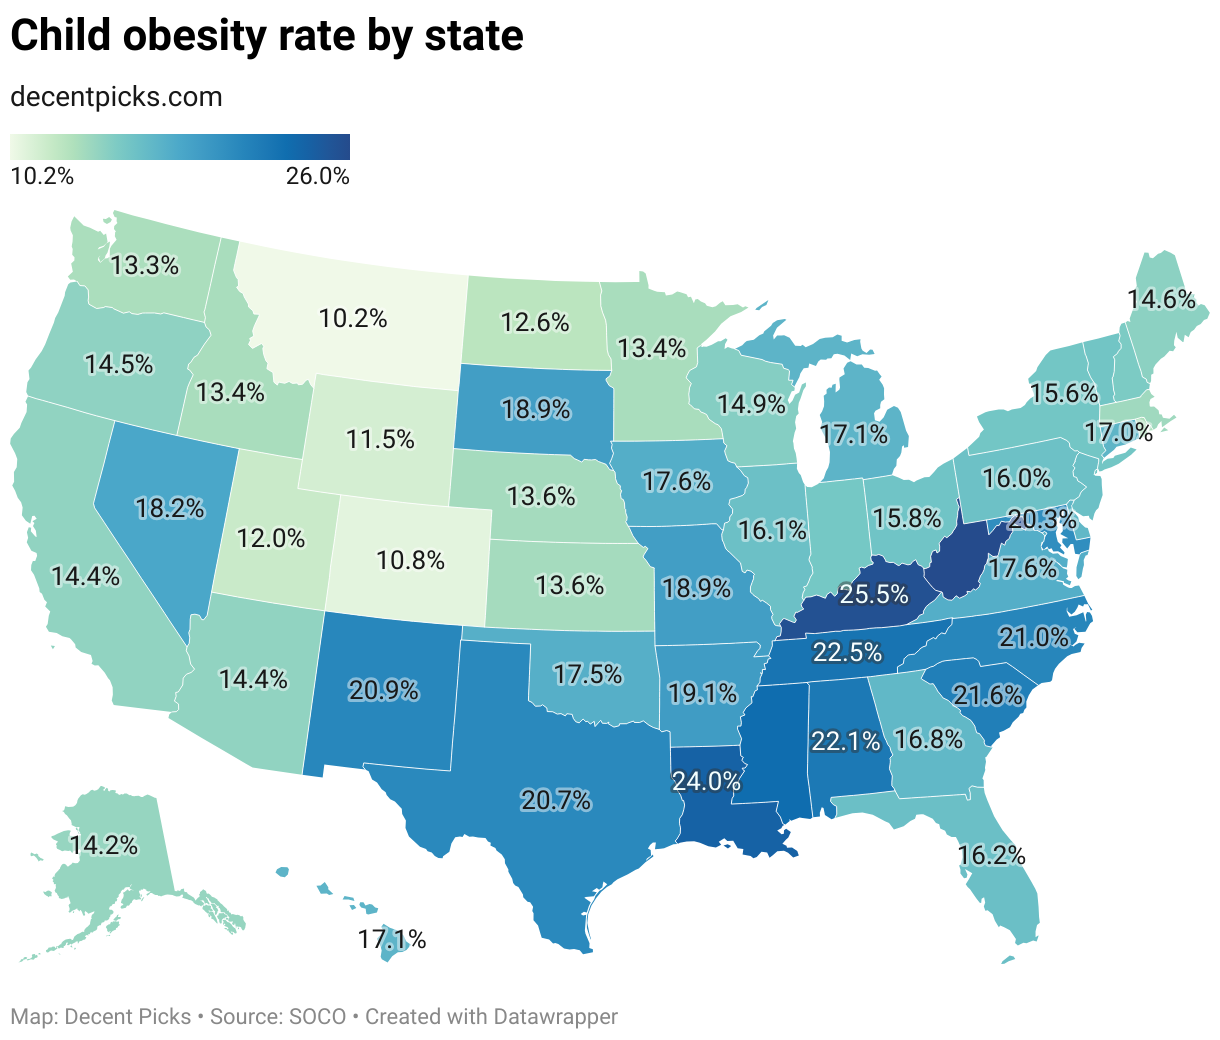
U.S. Teen Obesity Rates by State
The obesity epidemic isn’t limited to adults. Alarmingly, U.S. teenagers between the ages of 10 and 17 also display worrying obesity rates, with the South and East Coast often topping the charts.
States with High Teen Obesity Rates:
- West Virginia stands out with a staggering 26% obesity rate among teens.
- Kentucky, Louisiana, Mississippi, Tennessee, and Alabama are close followers, each with rates exceeding 22%.
States with Lower Teen Obesity Rates:
- Montana claims the lowest rate, with only 10.2% of its teens classified as obese.
- Colorado, Wyoming, Utah, and North Dakota also fare better, all registering teen obesity rates under 13%.

Complete Table of Obesity Rates by State
Trusted Website PubMed is a data base from US National Institutes of Health. It’s a trusted source of health and medical information. Open the link →
Disclosure: We are an Amazon Associate. Some links on this website are affiliate links, which means we may earn a commission or receive a referral fee when you sign up or make a purchase through those links.
Related Posts
 Ranking the Most and Least Obese Countries in the World

- America’s Most Aged States with the Highest Life Expectancy and Low Fertility Rates
- Countries with the Most Aged Populations
- Which States Have the Lowest Sales Tax?
- America’s Popular College Majors and Their Changes Over the Last Decade
- The World’s Wealthiest Countries in 2023
 The U.S. Senators Are Aged


Leave a Reply