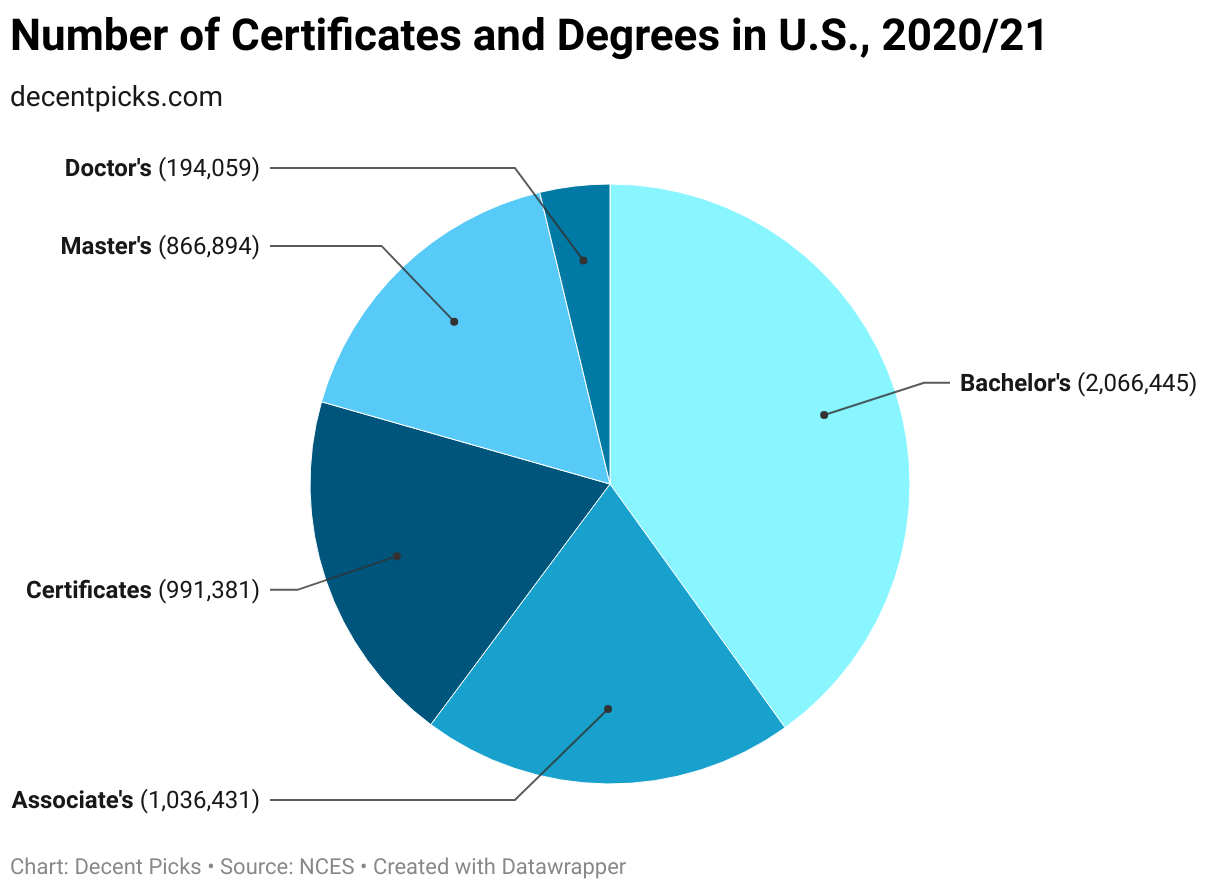
According to data from the National Center for Education Statistics, the U.S. awards about 5 million degrees or certificates annually. To give an idea, here’s a breakdown from the 2020/2021 academic year:
- Certificates: 19.23%
- Associate’s degrees: 20.10%
- Bachelor’s degrees: 40.08%
- Master’s degrees: 16.82%
- Doctoral degrees: 3.76%
In the 2021/2022 academic year, the U.S. awarded approximately 4.99 million certificates, a slight decrease from the previous year. Here’s a look at the most popular study areas:
- Health Professions and Related Programs: 894,000 degrees/certificates, marking a 13.75% increase from ten years ago.
- Business, Management, Marketing, and Related Support Services: 806,000 degrees/certificates, up by 9.54% from a decade ago.
- Liberal Arts and Sciences, General Studies, and Humanities: 537,000 degrees/certificates, a significant rise of 39.9%.
- Education: 317,000 degrees/certificates, down by 10.18%. Notably, within the top 10 disciplines, only Education and Visual & Performing Arts witnessed a drop in numbers.
- Computer and Information Sciences and Support Services: 249,000 degrees/certificates, doubling over the past ten years. This rate is second only to Military Technologies and Applied Sciences, and Science Technologies/Technicians, which surged by 303% and 116%, respectively. However, these latter fields remain niche, with just 4,192 and 6,899 degrees/certificates awarded in 2021.
Most Popular Degrees and Their Shifts in the Last 10 Years
Field of Study 2010 2021 Change Agriculture, Agriculture Operations and Related Sciences 28,709 47,792 66.47% Natural Resources and Conservation 19,160 29,909 56.10% Architecture and Related Services 18,870 17,893 -5.18% Area, Ethnic, Cultural, Gender, and Group Studies 12,227 12,327 0.82% Communication, Journalism, and Related Programs 96,860 111,886 15.51% Communications Technologies/Technicians and Support Services 12,238 13,680 11.78% Computer and Information Sciences and Support Services 124,601 249,177 99.98% Personal and Culinary Services 45,340 35,243 -22.27% Education 352,588 316,677 -10.18% Engineering 128,254 188,083 46.65% Engineering Technologies and Engineering-related Fields 83,182 76,766 -7.71% Foreign Languages, Literatures, and Linguistics 30,229 24,800 -17.96% Family and Consumer Sciences/Human Sciences 49,551 52,751 6.46% Legal Professions and Studies 73,446 65,887 -10.29% English Language and Literature/Letters 67,461 49,244 -27.00% Liberal Arts and Sciences, General Studies and Humanities 383,877 537,066 39.91% Library Science 8,548 6,895 -19.34% Biological and Biomedical Sciences 113,137 173,825 53.64% Mathematics and Statistics 26,601 45,509 71.08% Military Technologies and Applied Sciences 1,040 4,192 303.08% Multi/Interdisciplinary Studies 77,806 112,434 44.51% Parks, Recreation, Leisure and Fitness Studies 46,316 71,481 54.33% Philosophy and Religious Studies 15,996 16,403 2.54% Theology and Religious Vocations 26,840 24,155 -10.00% Physical Sciences 39,449 47,285 19.86% Science Technologies/Technicians 3,195 6,899 115.93% Psychology 137,574 193,523 40.67% Homeland Security, Law Enforcement, Firefighting, and Related Protective Service 128,928 134,050 3.97% Public Administration and Social Service Professions 76,364 95,905 25.59% Social Sciences 176,718 179,541 1.60% Construction Trades 28,421 29,340 3.23% Mechanic and Repair Technologies/Technicians 76,589 83,566 9.11% Precision Production 26,424 43,396 64.23% Transportation and Materials Moving 22,485 20,830 -7.36% Visual and Performing Arts 145,389 143,315 -1.43% Health Professions and Related Programs 785,803 893,848 13.75% Business, Management, Marketing, and Related Support Services 736,595 806,838 9.54% History 40,787 28,526 -30.06%
The National Center for Education Statistics provided a detailed breakdown of majors chosen by students of different ethnicities for the academic year 2021/2022:
- Health Professions and Related Programs is the top major for almost all ethnic groups, with the exception of the Hispanic community.
- Liberal Arts and Sciences, General Studies, and Humanities holds the top spot among Hispanics.
- Business, Management, Marketing, and Related Support Services is universally popular. It ranks fourth for Hispanics but is the second choice for all other ethnicities.
- Computer and Information Sciences and Support Services sees notable interest from Asians, being their third preferred major. Among Hispanics, it’s ranked eighth, while for other groups, it stands at fifth.
For non-resident foreigners, the sequence is as follows:
- Business, Management, Marketing, and Related Support Services
- Computer and Information Sciences and Support Services
- Engineering
- Social Sciences
- Health Professions and Related Programs
Notably, fields like Liberal Arts and Sciences, General Studies, and Humanities, which might pose challenges in job placements, are less popular among international students.
Degrees/Certificates in the U.S. for 2021/2022 Academic Year
Field of Study All Population Native American Asian African American Hispanic Pacific Islanders White Multiple Races Unknown Race Nonresident Alien Agricultural/Animal/Plant/Veterinary Science and Related Fields 47,792 296 1,229 1,796 6,624 68 33,169 1,665 1,261 1,684 Natural Resources and Conservation 29,909 242 1,147 791 3,215 55 20,881 1,319 956 1,303 Architecture and Related Services 17,893 50 1,366 958 2,958 20 8,315 613 398 3,215 Area, Ethnic, Cultural, Gender, and Group Studies 12,327 273 845 1,491 2,897 39 4,959 794 284 745 Communication, Journalism, and Related Programs 111,886 354 5,295 12,393 19,184 199 60,978 4,971 2,919 5,593 Communications Technologies/Technicians and Support Services 13,680 61 809 1,948 2,708 20 6,067 608 612 847 Computer and Information Sciences and Support Services 249,177 918 33,136 25,098 29,002 511 103,258 8,681 10,630 37,943 Culinary, Entertainment, and Personal Services 35,243 311 1,142 7,724 7,122 78 15,606 1,314 1,506 440 Education 316,677 1,977 9,821 33,614 43,931 602 197,475 8,487 14,396 6,374 Engineering 188,083 413 21,175 7,451 20,846 199 91,949 6,594 4,498 34,958 Engineering/Engineering-related Technologies/Technicians 76,766 549 3,633 6,503 12,098 163 44,977 2,332 2,799 3,712 Foreign Languages, Literatures, and Linguistics 24,800 89 1,520 1,093 6,861 23 11,671 1,053 631 1,859 Family and Consumer Sciences/Human Sciences 52,751 364 3,038 7,131 14,434 114 23,688 1,803 1,267 912 Legal Professions and Studies 65,887 455 3,421 5,775 8,597 104 33,813 2,112 3,673 7,937 English Language and Literature/Letters 49,244 192 2,207 3,997 8,109 64 29,709 2,214 1,731 1,021 Liberal Arts and Sciences, General Studies and Humanities 537,066 3,561 31,504 59,078 148,402 1,254 244,378 22,000 16,304 10,585 Library Science 6,895 33 239 357 748 10 4,933 223 298 54 Biological and Biomedical Sciences 173,825 573 25,401 14,091 26,873 263 84,941 7,679 4,346 9,658 Mathematics and Statistics 45,509 76 6,080 1,356 4,994 43 17,791 1,399 1,130 12,640 Military Technologies and Applied Sciences 4,192 17 168 389 592 13 2,429 167 274 143 Multi/Interdisciplinary Studies 112,434 509 11,658 9,985 24,550 239 50,161 4,513 3,967 6,852 Parks, Recreation, Leisure, Fitness, and Kinesiology 71,481 359 3,536 8,928 12,138 181 39,485 2,930 1,820 2,104 Philosophy and Religious Studies 16,403 51 682 851 1,644 29 11,217 528 550 851 Theology and Religious Vocations 24,155 113 957 3,604 1,866 63 13,854 550 1,693 1,455 Physical Sciences 47,285 160 4,579 2,239 5,947 47 24,594 1,907 1,175 6,637 Science Technologies/Technicians 6,899 33 390 995 1,755 13 3,160 263 151 139 Psychology 193,523 922 12,760 21,540 42,887 358 93,804 8,331 7,187 5,734 Homeland Security, Law Enforcement, Firefighting and Related Protective Services 134,050 922 3,632 19,332 34,712 413 62,870 4,415 6,338 1,416 Public Administration and Social Service Professions 95,905 695 3,237 17,965 17,112 204 47,025 3,258 3,854 2,555 Social Sciences 179,541 701 14,050 15,451 37,819 380 82,127 7,879 4,969 16,165 Construction Trades 29,340 355 642 2,705 5,786 75 17,631 707 1,292 147 Mechanic and Repair Technologies/Technicians 83,566 651 2,716 8,912 18,953 232 44,179 2,895 4,392 636 Precision Production 43,396 636 629 3,631 7,459 117 27,901 1,166 1,700 157 Transportation and Materials Moving 20,830 276 602 4,501 2,461 55 10,246 699 1,184 806 Visual and Performing Arts 143,315 641 9,232 11,498 24,295 210 74,418 6,514 5,445 11,062 Health Professions and Related Programs 893,848 5,738 68,830 120,398 138,551 2,701 472,068 28,036 44,303 13,223 Business, Management, Marketing, and Related Support Services 806,838 4,281 58,682 91,033 122,095 1,907 405,360 24,750 39,965 58,765 History 28,526 113 925 1,340 4,703 33 18,704 1,185 919 604
Disclosure: We are an Amazon Associate. Some links on this website are affiliate links, which means we may earn a commission or receive a referral fee when you sign up or make a purchase through those links.
Related Posts
 Best & Worst College Majors in the U.S. for High-Paying & Stable Jobs
 America’s Most Aged States with the Highest Life Expectancy and Low Fertility Rates
- Countries with the Most Aged Populations
- Which States Have the Lowest Sales Tax?
- America’s Growing Challenge with Gun Violence
- Electric Vehicle Sales and Market Share in the U.S.
- States with the Highest and Lowest Obesity Rates in the U.S.
 The Art of Setting Age-Appropriate Allowances: A Parent’s Guide to Raise Money-Savvy Kids
- The World’s Wealthiest Countries in 2023
- Can I Seek Compensation If I Discover Problems After Buying a House?
 The U.S. Senators Are Aged


Leave a Reply