America’s getting older.
Based on census data, back in 2000, the median age in the U.S. was 35.3 years – meaning, about half of Americans were older than that and half younger. By 2010, the median age rose to 37.2 years, and by 2020, it increased to 38.8 years.
The “oldest” states in America
Maine is the “oldest” state, with a median age of 44.8 years. From the age distribution chart, you’ll notice that folks 65 and older make up 21.8% of Maine’s population – even higher than that of the retirement hotspot Florida.
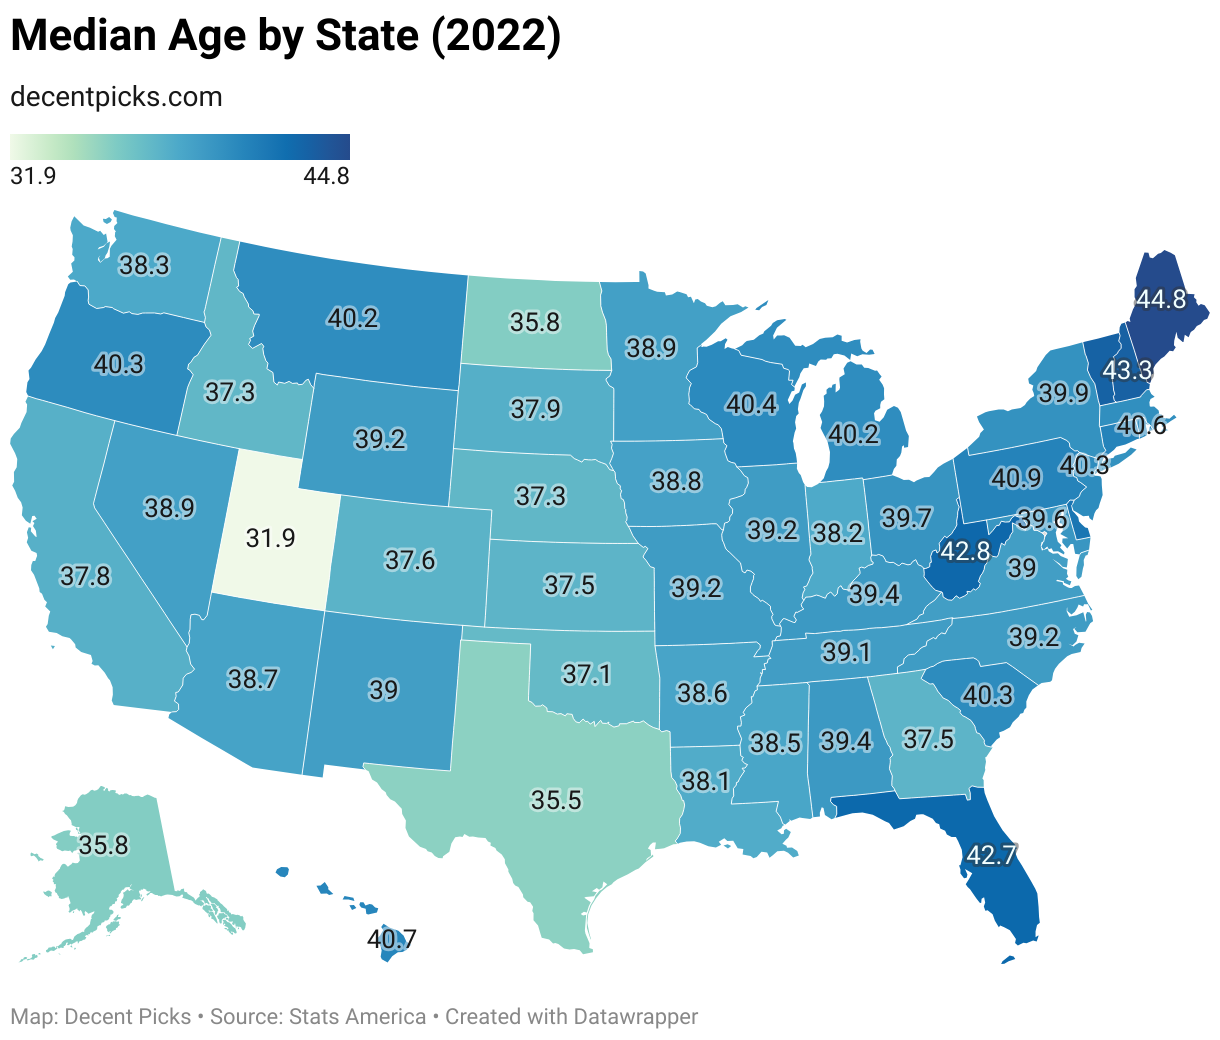
Chart: Median age, life expectancy, and fertility rates in U.S. states
State Median Age Rank Life Expectancy Rank Fertility Rate Rank Alabama 39.4 21 73.2 47 1.77 16 Alaska 35.8 47 76.6 29 1.89 5 Arizona 38.7 33 76.3 32 1.64 32 Arkansas 38.6 34 73.8 44 1.84 9 California 37.8 40 79 4 1.54 43 Colorado 37.6 41 78.3 12 1.52 44 Connecticut 40.9 7 78.4 10 1.58 38 Delaware 41.8 6 76.7 27 1.68 27 Florida 42.7 5 77.5 19 1.62 34 Georgia 37.5 42 75.6 37 1.67 28 Hawaii 40.7 9 80.7 1 1.73 20 Idaho 37.3 44 78.4 10 1.85 7 Illinois 39.2 23 76.8 23 1.57 40 Indiana 38.2 37 75 40 1.79 15 Iowa 38.8 32 77.5 19 1.85 7 Kansas 37.5 42 76.4 31 1.84 9 Kentucky 39.4 21 73.5 46 1.81 13 Louisiana 38.1 38 73.1 48 1.87 6 Maine 44.8 1 77.8 14 1.48 45 Maryland 39.6 20 76.8 23 1.66 29 Massachusetts 40.1 17 79 4 1.43 47 Michigan 40.2 15 76 36 1.64 32 Minnesota 38.9 30 79.1 3 1.75 17 Mississippi 38.5 35 71.9 50 1.82 12 Missouri 39.2 23 75.1 39 1.73 20 Montana 40.2 15 76.8 23 1.62 34 Nebraska 37.3 44 77.7 15 1.95 2 Nevada 38.9 30 76.3 32 1.61 36 New Hampshire 43.3 2 79 4 1.48 45 New Jersey 40.3 12 77.5 19 1.72 23 New Mexico 39 28 74.5 42 1.58 38 New York 39.9 18 77.7 15 1.56 41 North Carolina 39.2 23 76.1 35 1.73 20 North Dakota 35.8 47 76.9 22 1.94 3 Ohio 39.7 19 75.3 38 1.72 23 Oklahoma 37.1 46 74.1 43 1.83 11 Oregon 40.3 12 78.8 7 1.43 47 Pennsylvania 40.9 7 76.8 23 1.61 36 Rhode Island 40.6 10 78.2 13 1.42 49 South Carolina 40.3 12 74.8 41 1.71 25 South Dakota 37.9 39 76.7 27 2.07 1 Tennessee 39.1 27 73.8 44 1.75 17 Texas 35.5 49 76.5 30 1.81 13 Utah 31.9 50 78.6 9 1.92 4 Vermont 43.2 3 78.8 7 1.37 50 Virginia 39 28 77.6 18 1.66 29 Washington 38.3 36 79.2 2 1.56 41 West Virginia 42.8 4 72.8 49 1.65 31 Wisconsin 40.4 11 77.7 15 1.69 26 Wyoming 39.2 23 76.3 32 1.75 17
Maine has a limited number of people in the prime marriage and childbearing ages, making up only 11.3% of its population aged 26-34, placing it 41st in the U.S. Additionally, its fertility rate stands at 1.48, which is the 45th lowest in the country.
Because of this combination of a smaller childbearing age group and low fertility rate, Maine has notably few children and young adults. Only 19.0% of its population is aged 0-18, and just 6.8% are between 19-25—these are the lowest percentages nationwide. This trend may lead to significant demographic challenges in the future.
Chart: Age distribution of U.S. state populations
State 0-18 19-25 26-34 35-54 55-64 65+ Alabama 23.6% 8.7% 11.3% 25.1% 13.7% 17.7% Alaska 26.4% 8.5% 13.2% 25.8% 12.5% 13.7% Arizona 23.6% 8.8% 12.3% 24.5% 12.2% 18.6% Arkansas 24.6% 8.7% 11.5% 24.7% 13.0% 17.4% California 23.6% 8.7% 13.4% 26.6% 12.3% 15.3% Colorado 22.7% 8.6% 14.1% 27.0% 12.3% 15.3% Connecticut 21.6% 8.3% 11.4% 25.9% 14.7% 18.0% Delaware 21.8% 7.8% 11.3% 24.3% 14.7% 20.1% District of Columbia 19.8% 7.9% 21.0% 27.8% 10.3% 13.2% Florida 20.8% 7.7% 11.2% 25.1% 13.9% 21.3% Georgia 25.0% 8.6% 12.2% 26.6% 12.6% 14.9% Hawaii 22.6% 7.1% 11.5% 25.2% 13.2% 20.4% Idaho 26.1% 8.6% 11.7% 24.8% 12.1% 16.7% Illinois 23.5% 8.5% 12.1% 26.2% 13.2% 16.6% Indiana 24.6% 8.9% 11.9% 25.1% 13.1% 16.4% Iowa 24.4% 8.9% 11.2% 24.4% 13.4% 17.7% Kansas 25.4% 9.1% 11.3% 24.5% 13.0% 16.6% Kentucky 23.7% 8.7% 11.6% 25.2% 13.6% 17.2% Louisiana 24.8% 8.9% 11.7% 24.9% 13.0% 16.7% Maine 19.0% 6.8% 11.3% 25.3% 15.8% 21.8% Maryland 23.4% 7.8% 12.0% 26.5% 13.9% 16.4% Massachusetts 21.0% 8.2% 13.0% 26.1% 14.2% 17.6% Michigan 22.6% 8.8% 11.8% 24.5% 14.1% 18.2% Minnesota 24.1% 8.2% 11.9% 25.7% 13.4% 16.8% Mississippi 25.2% 9.0% 10.7% 25.2% 13.0% 17.1% Missouri 23.9% 8.3% 11.8% 24.8% 13.6% 17.6% Montana 22.2% 8.9% 11.5% 23.8% 13.8% 19.8% Nebraska 26.0% 8.8% 11.8% 24.5% 12.5% 16.4% Nevada 23.3% 8.1% 12.9% 26.5% 12.6% 16.7% New Hampshire 19.8% 7.6% 11.9% 25.4% 16.0% 19.3% New Jersey 23.0% 7.9% 11.7% 26.6% 14.0% 16.8% New Mexico 24.1% 8.4% 11.6% 24.2% 13.1% 18.7% New York 21.9% 8.1% 12.9% 25.8% 13.8% 17.5% North Carolina 23.4% 8.3% 11.7% 26.1% 13.3% 17.3% North Dakota 25.3% 9.8% 12.6% 23.9% 12.4% 16.0% Ohio 23.4% 8.4% 11.9% 24.8% 13.7% 17.8% Oklahoma 25.6% 9.0% 11.7% 24.9% 12.4% 16.3% Oregon 21.1% 8.2% 12.7% 26.6% 12.6% 18.7% Pennsylvania 21.9% 7.7% 12.0% 25.0% 14.3% 19.0% Rhode Island 20.5% 8.5% 12.5% 25.5% 14.7% 18.3% South Carolina 23.0% 8.2% 11.4% 24.9% 13.7% 18.9% South Dakota 26.0% 9.0% 11.0% 23.1% 13.5% 17.5% Tennessee 23.2% 8.5% 12.2% 25.6% 13.4% 17.1% Texas 26.8% 9.1% 13.0% 26.4% 11.4% 13.3% Utah 30.0% 10.8% 13.2% 25.0% 9.4% 11.7% Vermont 19.3% 8.2% 11.0% 25.0% 15.6% 20.9% Virginia 23.4% 8.3% 11.9% 26.4% 13.4% 16.7% Washington 22.8% 8.2% 13.6% 26.5% 12.6% 16.3% West Virginia 21.2% 8.3% 10.1% 25.2% 14.3% 20.9% Wisconsin 22.8% 8.5% 11.4% 24.9% 14.4% 17.9% Wyoming 24.0% 8.5% 10.4% 25.8% 13.2% 18.1%
Not far behind are New Hampshire and Vermont, with median ages of 43.3 and 43.2 respectively, ranking second and third. These states, along with Maine, are all in the Northeastern New England region, which has been aging for quite some time now.

Several factors contribute to this aging trend. These states have among the highest white populations (over 90%) and fewer of the typically higher fertility rate groups, such as Latinos and African Americans. Plus, a lot of younger folks head out to find jobs in places like DC, Texas, or California.
Other states with median ages above 42 are West Virginia and Florida. West Virginia, like New England, has a predominantly white population and a lower fertility rate. While Florida’s fertility rate is a tad higher, it’s known as a retirement destination. The 65+ crowd makes up 21.3% of its population, just behind Maine.
The “youngest” states in America
The “youngest” state in America? That’s Utah, with a median age of just 31.9 years.
Utah is notably home to a significant Mormon population. Back in the mid-19th century, Mormons, persecuted and vilified at the time, fled from the East Coast. They moved from New York to Illinois and then headed further west into the Rocky Mountains, settling in present-day Utah, which was then a part of Mexico.

Today, over two million Mormons live in Utah, making up 55% of its population and one-third of all Mormons in the U.S. They have strong family values – a 2014 Pew survey found that Mormons tend to marry and have more kids than other groups, including Christians and non-believers. For most Mormons, a successful marriage and parenthood are top life priorities.
As a result, Utah’s fertility rate has consistently ranked among the nation’s highest. Additionally, its economy has been thriving in recent years, and during the pandemic, it had one of the lowest unemployment rates in the country.
As seen in the age distribution chart, 30.0% of Utah’s population is aged 0-18, and 10.8% are 19-25 – both the highest nationwide. And while its life expectancy of 78.6 years is quite high, ranking 9th in the U.S., it remains the youngest state in the country.

Texas comes in as the second “youngest” state, with a median age of 35.5 years – a full 3.6 years older than Utah, showing just how unique Utah is.
Texas has a booming economy that offers plenty of job opportunities, while the cost of living, especially housing, is more affordable than in states like California or New York. Additionally, Texas does not impose a personal income tax. In recent years, Texas has consistently seen the largest net population gain in the nation, with more people moving in than moving out, attracting professionals from costlier areas.
The two largest age groups in Texas are 35-54 year-olds, making up 26.4%, and kids 0-18 years old, at 26.8%. Essentially, this matches up with career-driven adults and their children. In contrast, whether it’s young adults aged 19-25, early career folks aged 26-34, or the middle-aged and seniors 55 and older, none of these groups make up more than 14% of the population.
States with a median age under 36 also include North Dakota and Alaska, both clocking in at 35.8 years.
States with the longest and shortest life expectancies
Hawaii boasts the longest life expectancy at 80.7 years. Some reasons for this longevity include lower smoking and obesity rates, leading to fewer instances of cancer and heart disease. Only 25.9% of adults in Hawaii are obese, ranking them 52nd out of all US states and territories. That’s just a tad higher than Colorado and D.C.
Other states with life expectancies of 79 years or more include Washington, Minnesota, New Hampshire, Massachusetts, and California.

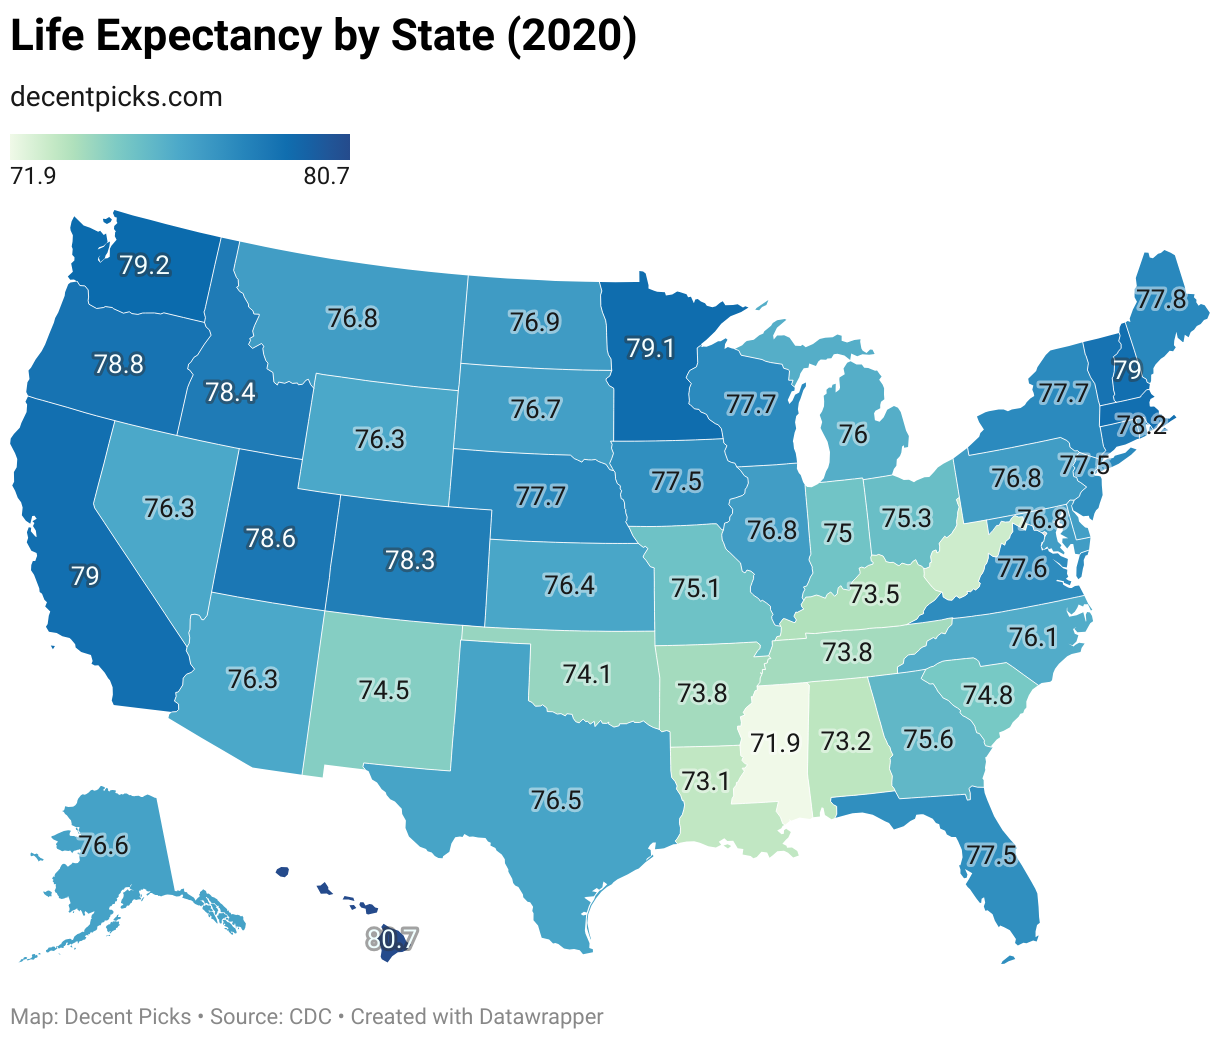
On the flip side, Mississippi has the shortest life expectancy at just 71.9 years – that’s a significant 8.8 years less than Hawaii. The reasons? Poverty and unhealthy lifestyles, which probably feed into each other in a vicious cycle.
Mississippi is the poorest state in the U.S. with a poverty rate of 19.58%. It’s also one of the fattest, with an adult obesity rate of 39.5%, ranking 4th in the nation. A staggering one-third of adults in the state reportedly never exercise.
Besides Mississippi, six other states have life expectancies under 74 years: West Virginia, Louisiana, Alabama, Kentucky, Tennessee, and Arkansas. Poverty and high obesity rates are common threads among these states.

States With the Highest and Lowest Fertility Rates
Over the past few decades, fertility rates in the U.S. have been on a steady decline. In 2008, the national average was 2.08 children per woman, with Utah leading at 2.60. Fast forward to 2021, and the national average has dropped to 1.66. South Dakota now tops the list with a rate of 2.07, which is even slightly lower than the 2008 national average.
To maintain a stable population, the total fertility rate needs to hover around 2.1. In other words, on average, each woman should have about 2.1 kids if the population is not to decline. This accounts for the fact that some kids won’t reach adulthood and that slightly more boys are born than girls, and not all of these boys will reproduce.
That being said, without an influx of immigrants, even South Dakota, with the highest fertility rate, would only just barely maintain its current population level. As for the entire U.S. population, it’d shrink quickly without a significant number of immigrants coming in.

South Dakota’s relatively high fertility rate can be partly credited to its Indigenous population, which makes up almost 9% of its residents. This is the third-highest proportion in the U.S., and their fertility rates are 60% higher than that of whites. The state’s steady economy also plays a role — while it might not be booming, its unemployment rate remains consistently below the national average.
In addition to South Dakota, there are five more states with fertility rates above 1.85: Alaska, Nebraska, North Dakota, Utah, and Louisiana.
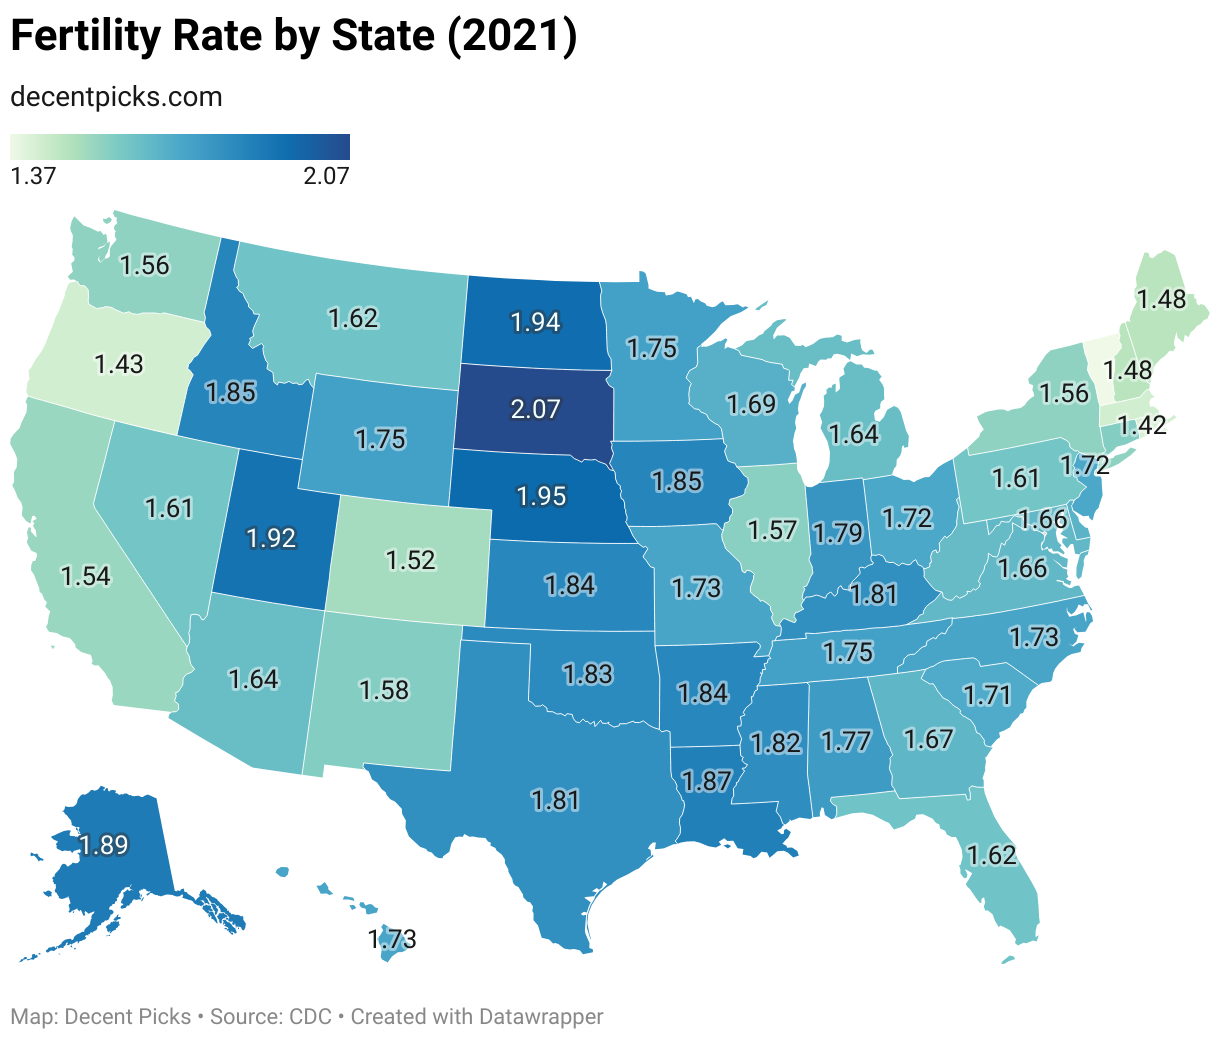
The state with the lowest fertility rate is Vermont, at a mere 1.37. Other states with fertility rates below 1.5 include Rhode Island, Oregon, Massachusetts, Maine, and New Hampshire. As previously mentioned, the northern New England states of Vermont, Maine, and New Hampshire have some of the oldest populations in the U.S. – dominated by whites, high median ages, and super low fertility rates.
Disclosure: We are an Amazon Associate. Some links on this website are affiliate links, which means we may earn a commission or receive a referral fee when you sign up or make a purchase through those links.
Related Posts
 Countries with the Most Aged Populations
 Which States Have the Lowest Sales Tax?
- America’s Popular College Majors and Their Changes Over the Last Decade

- America’s Growing Challenge with Gun Violence
 USCIS Proposes Major Changes to H-1B Visa Process, 8 Key Changes You Should Know
- Electric Vehicle Sales and Market Share in the U.S.
- States with the Highest and Lowest Obesity Rates in the U.S.
- Best & Worst College Majors in the U.S. for High-Paying & Stable Jobs
- The World’s Wealthiest Countries in 2023


Leave a Reply