Around the world, over 500 million people face challenges related to obesity. The rate of global obesity has more than doubled since the 1980s, impacting both wealthy and emerging nations. Intriguingly, even in poorer areas like sub-Saharan Africa, it’s possible to find households with both undernourished children and overweight adults.
A Worrying Global Trend
Obesity-related health problems, such as heart diseases, strokes, and Type 2 diabetes, are increasingly prevalent in low to middle-income countries. In fact, nearly 80% of all heart-related conditions now arise in these nations. Countries with a GDP below $5,000, like Pakistan and Nigeria, are especially vulnerable to heart issues stemming from obesity and elevated cholesterol levels.

Several socioeconomic factors contribute to the global surge in obesity. This includes the evolution of national economies, urban expansion, more women joining the workforce (notably, in areas outside Europe, women experience higher obesity rates than men), and the growing accessibility of inexpensive, yet unhealthy, fast food.
Research indicates a unique relationship between a country’s GDP per capita and average BMI:
- In countries with lower incomes, an increase in GDP is associated with a rise in average BMI.
- Conversely, in wealthier countries, a higher GDP often corresponds to a decrease in average BMI.
Global Obesity Rates by Country
The table, by default, displays obesity rates for adult males and females. To view the obesity rates for boys and girls, you can tick the respective checkboxes. Additionally, by clicking on the headers of each column, you can sort the data in ascending or descending order.
Country Girls Boys Men Women Afghanistan 3.07% 2.94% 3.36% 8.00% Albania 5.80% 9.98% 22.37% 22.72% Algeria 12.41% 13.87% 20.67% 36.22% American Samoa 27.88% 30.58% 58.75% 65.32% Andorra 10.28% 14.75% 26.75% 26.34% Angola 2.94% 1.71% 4.23% 12.61% Antigua and Barbuda 11.85% 11.29% 12.09% 26.97% Argentina 12.94% 20.76% 28.23% 30.14% Armenia 4.19% 5.20% 17.75% 24.02% Australia 11.22% 13.51% 30.57% 29.51% Austria 6.06% 11.28% 22.65% 19.10% Azerbaijan 4.35% 5.34% 16.47% 24.55% The Bahamas 16.82% 18.08% 25.30% 39.48% Bahrain 15.75% 18.29% 26.46% 38.19% Bangladesh 2.27% 3.03% 2.37% 5.19% Barbados 12.31% 12.45% 15.27% 32.58% Belarus 4.78% 10.12% 22.91% 27.34% Belgium 5.76% 8.10% 23.99% 21.87% Belize 11.86% 12.53% 17.12% 32.72% Benin 3.79% 1.38% 4.90% 14.84% Bermuda 17.45% 21.94% 29.91% 43.17% Bhutan 2.46% 4.09% 4.92% 8.90% Bolivia 8.46% 9.69% 15.07% 26.56% Bosnia and Herzegovina 4.62% 6.97% 17.82% 19.25% Botswana 9.07% 3.48% 8.50% 30.50% Brazil 9.37% 12.70% 19.24% 26.44% Brunei 9.86% 18.27% 13.00% 16.43% Bulgaria 7.79% 13.55% 26.37% 25.27% Burkina Faso 1.22% 0.76% 2.70% 8.49% Burundi 2.38% 1.14% 2.20% 9.00% Cape Verde 4.06% 2.30% 7.19% 17.03% Cambodia 1.17% 5.08% 2.84% 5.06% Cameroon 3.99% 1.50% 6.39% 17.17% Canada 9.92% 14.73% 30.47% 30.44% Central African Republic 2.84% 1.56% 3.86% 11.41% Chad 1.99% 0.90% 3.23% 9.34% Chile 12.99% 17.64% 25.73% 32.13% China 7.11% 15.39% 6.11% 6.83% Colombia 6.44% 7.46% 18.28% 27.70% Comoros 3.81% 1.61% 3.44% 12.71% Congo 1.71% 2.14% 5.77% 14.11% Cook Islands 31.10% 33.30% 53.97% 60.85% Costa Rica 12.07% 12.84% 21.83% 31.53% Côte d’Ivoire 4.22% 2.54% 6.07% 15.84% Croatia 8.01% 13.99% 24.98% 25.57% Cuba 10.56% 12.79% 19.67% 31.58% Cyprus 8.91% 15.81% 22.65% 22.52% Czechia 6.45% 12.33% 27.32% 26.50% Democratic Republic of Congo 2.97% 1.26% 3.73% 10.12% Denmark 4.90% 9.48% 23.15% 17.71% Djibouti 5.90% 4.47% 8.98% 19.11% Dominica 15.56% 14.64% 20.69% 36.91% Dominican Republic 14.12% 15.69% 21.77% 35.42% Ecuador 8.28% 10.50% 15.45% 25.64% Egypt 19.14% 15.66% 23.50% 42.48% El Salvador 12.60% 11.16% 19.60% 30.03% Equatorial Guinea 2.85% 1.57% 3.95% 13.17% Eritrea 2.91% 1.16% 2.13% 7.91% Estonia 4.62% 7.63% 21.13% 22.74% Eswatini 9.30% 2.69% 5.63% 27.22% Ethiopia 1.41% 0.77% 1.98% 7.25% Micronesia 22.31% 19.72% 41.48% 53.17% Fiji 11.43% 11.23% 25.95% 36.50% Finland 5.64% 12.45% 24.62% 21.50% France 7.26% 8.92% 22.86% 21.97% French Polynesia 27.90% 29.09% 48.89% 56.90% Gabon 4.53% 3.58% 10.04% 21.17% The Gambia 3.39% 2.09% 5.87% 15.46% Georgia 4.50% 8.51% 19.91% 24.77% Germany 6.88% 11.20% 25.04% 21.33% Ghana 3.15% 1.05% 4.75% 17.34% Greece 10.64% 16.70% 25.04% 26.44% Greenland (Den.) 7.27% 10.74% 24.66% 22.72% Grenada 10.73% 10.76% 13.88% 30.22% Guatemala 9.72% 9.82% 15.67% 27.45% Guinea 2.36% 0.90% 3.87% 12.01% Guinea-Bissau 3.02% 1.60% 5.25% 14.28% Guyana 10.23% 9.78% 13.20% 28.19% Haiti 7.63% 13.94% 18.63% 28.07% Honduras 9.81% 9.28% 16.24% 27.91% Hong Kong 6.16% 14.74% 11.38% 10.74% Hungary 8.46% 13.75% 29.12% 25.64% Iceland 7.18% 12.47% 25.11% 20.24% India 1.59% 2.44% 2.87% 5.31% Indonesia 4.95% 7.14% 4.98% 9.28% Iran 8.65% 10.59% 19.98% 33.47% Iraq 14.23% 14.24% 24.30% 38.33% Ireland 8.98% 10.23% 25.97% 26.55% Israel 9.31% 13.93% 26.82% 27.30% Italy 10.45% 14.54% 20.94% 20.41% Jamaica 13.42% 13.12% 15.89% 34.72% Japan 1.73% 4.99% 4.97% 3.86% Jordan 12.55% 12.92% 29.17% 44.60% Kazakhstan 4.77% 7.77% 19.57% 23.65% Kenya 3.16% 1.21% 2.97% 11.61% Kiribati 23.92% 22.47% 42.87% 51.96% Kuwait 20.20% 25.35% 34.28% 47.08% Kyrgyzstan 2.64% 4.81% 14.60% 19.47% Laos 3.02% 6.15% 3.90% 7.02% Latvia 4.91% 8.80% 22.38% 26.17% Lebanon 11.93% 16.92% 28.38% 38.44% Lesotho 8.71% 1.37% 4.86% 27.73% Liberia 2.49% 1.24% 5.73% 14.82% Libya 13.30% 15.40% 25.85% 41.08% Lithuania 4.77% 8.76% 25.01% 28.94% Luxembourg 6.26% 10.57% 25.38% 21.57% Madagascar 1.66% 1.86% 3.11% 7.89% Malawi 2.78% 1.05% 2.31% 9.56% Malaysia 10.36% 15.44% 13.44% 18.64% Maldives 5.35% 9.30% 6.08% 11.88% Mali 3.76% 1.27% 4.76% 12.92% Malta 11.27% 16.07% 30.11% 29.63% Marshall Islands 27.73% 25.79% 49.85% 59.02% Mauritania 5.32% 2.48% 6.92% 19.26% Mauritius 5.42% 3.77% 5.83% 16.35% Mexico 12.85% 16.80% 25.12% 33.98% Moldova 3.20% 5.02% 16.80% 22.03% Mongolia 3.32% 4.94% 18.24% 24.22% Montenegro 5.34% 9.80% 24.11% 24.10% Morocco 9.92% 10.34% 20.17% 33.43% Mozambique 3.03% 1.34% 3.42% 11.00% Myanmar 2.30% 5.22% 4.21% 7.61% Namibia 6.82% 2.94% 7.85% 26.48% Nauru 33.39% 33.14% 59.85% 64.81% Nepal 1.87% 1.53% 2.80% 5.64% Netherlands 5.70% 8.49% 21.57% 20.86% New Zealand 14.96% 17.48% 31.07% 32.58% Nicaragua 11.42% 10.24% 18.61% 30.08% Niger 1.99% 0.64% 2.58% 9.10% Nigeria 2.06% 1.66% 4.82% 13.65% Niue 28.14% 30.87% 46.17% 56.77% North Korea 5.56% 11.66% 6.34% 7.59% North Macedonia 6.53% 12.11% 23.44% 23.00% Norway 7.71% 10.42% 24.49% 23.48% Oman 13.34% 16.08% 23.77% 34.97% Pakistan 2.52% 3.60% 6.26% 11.75% Palau 31.01% 31.92% 53.15% 60.48% Palestine 12.48% 13.85% 27.17% 40.22% Panama 11.40% 9.54% 18.48% 28.69% Papua New Guinea 10.07% 9.35% 17.26% 26.79% Paraguay 9.28% 11.66% 17.80% 24.39% Peru 6.82% 8.81% 15.77% 25.14% Philippines 2.55% 5.97% 5.47% 7.86% Poland 5.26% 12.66% 24.63% 23.22% Portugal 10.31% 10.82% 21.12% 22.12% Puerto Rico 17.66% 20.55% 29.05% 41.55% Qatar 15.96% 22.14% 33.46% 44.60% Romania 5.44% 10.69% 24.22% 22.55% Russia 4.28% 9.15% 18.88% 28.11% Rwanda 2.74% 0.57% 2.01% 9.74% Saint Kitts and Nevis 11.95% 12.78% 15.92% 31.33% Saint Lucia 9.25% 8.58% 12.49% 28.08% Saint Vincent and the Grenadines 12.20% 12.90% 17.20% 32.27% Samoa 23.32% 19.85% 41.28% 56.62% São Tomé and Príncipe 3.85% 2.87% 7.51% 17.66% Saudi Arabia 14.15% 19.69% 31.73% 43.74% Senegal 2.54% 0.99% 4.15% 13.50% Serbia 7.13% 12.66% 21.86% 22.79% Seychelles 10.80% 10.77% 7.90% 21.39% Sierra Leone 3.87% 1.10% 3.98% 13.88% Singapore 4.47% 9.57% 6.07% 6.63% Slovakia 5.69% 10.42% 21.75% 20.80% Slovenia 7.43% 10.57% 20.12% 21.87% Solomon Islands 4.96% 3.68% 18.61% 28.13% Somalia 3.81% 2.06% 4.12% 12.82% South Africa 12.81% 9.82% 15.98% 40.99% South Korea 4.66% 12.92% 4.57% 5.03% Spain 8.20% 12.85% 25.49% 23.78% Sri Lanka 4.42% 5.03% 2.98% 7.59% Sudan 3.61% 2.03% 3.95% 12.93% Suriname 12.32% 15.73% 19.64% 34.99% Sweden 4.67% 8.53% 23.89% 18.83% Switzerland 4.65% 7.00% 23.00% 17.59% Syria 10.79% 12.02% 21.64% 36.09% Taiwan 6.70% 15.42% 7.27% 8.63% Tajikistan 2.47% 3.33% 12.05% 17.41% Tanzania 3.17% 1.66% 4.16% 13.22% Thailand 8.68% 14.16% 7.26% 13.25% Timor-Leste 2.84% 5.44% 2.76% 5.15% Togo 2.52% 1.33% 4.03% 13.06% Tokelau 24.43% 24.15% 41.40% 52.18% Tonga 29.64% 23.76% 42.72% 56.06% Trinidad and Tobago 10.78% 11.09% 11.23% 27.10% Tunisia 8.80% 8.19% 19.87% 35.62% Turkey 10.92% 12.18% 25.29% 40.71% Turkmenistan 3.58% 5.64% 16.49% 21.84% Tuvalu 28.98% 25.60% 48.47% 57.85% Uganda 2.79% 0.51% 1.92% 9.00% Ukraine 4.74% 8.88% 22.76% 26.72% United Arab Emirates 14.74% 18.53% 28.44% 42.46% United Kingdom 9.37% 10.87% 27.88% 29.71% United States of America 19.47% 23.29% 36.47% 38.16% Uruguay 11.51% 16.21% 25.79% 31.80% Uzbekistan 3.05% 4.86% 14.37% 19.86% Vanuatu 8.30% 7.95% 20.96% 31.21% Venezuela 13.19% 14.85% 23.21% 29.75% Vietnam 1.27% 3.69% 1.67% 2.71% Yemen 7.43% 6.52% 12.46% 22.97% Zambia 3.44% 2.09% 3.72% 12.99% Zimbabwe 6.54% 1.42% 4.93% 26.32%

For Adult Men
- Nauru tops the list, with a staggering 59.85% of its male adult population being obese.
- Following closely are American Samoa, the Cook Islands, and Palau, all with rates exceeding 50%.
- The U.S. has an adult male obesity rate of 36.47%, ranking 14th out of the 200 countries and regions surveyed, and is the highest among developed nations.
- Canada stands at 30.47%, coming in 20th.
- On the flip side, Vietnam has the lowest obesity rate at just 1.67%, trailed by Uganda, Ethiopia, Rwanda, and Eritrea.
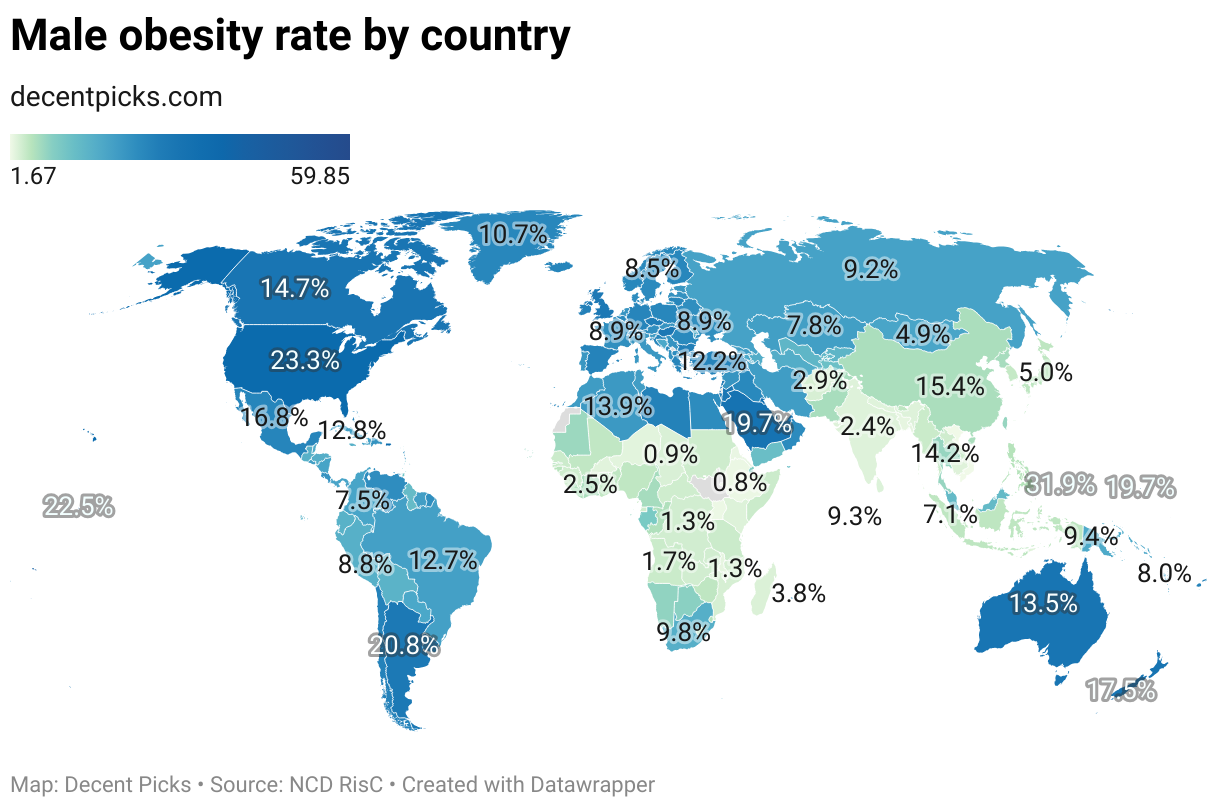
In the U.S., generally speaking, the South has a higher obesity rate than the North, and the East Coast surpasses the West Coast.
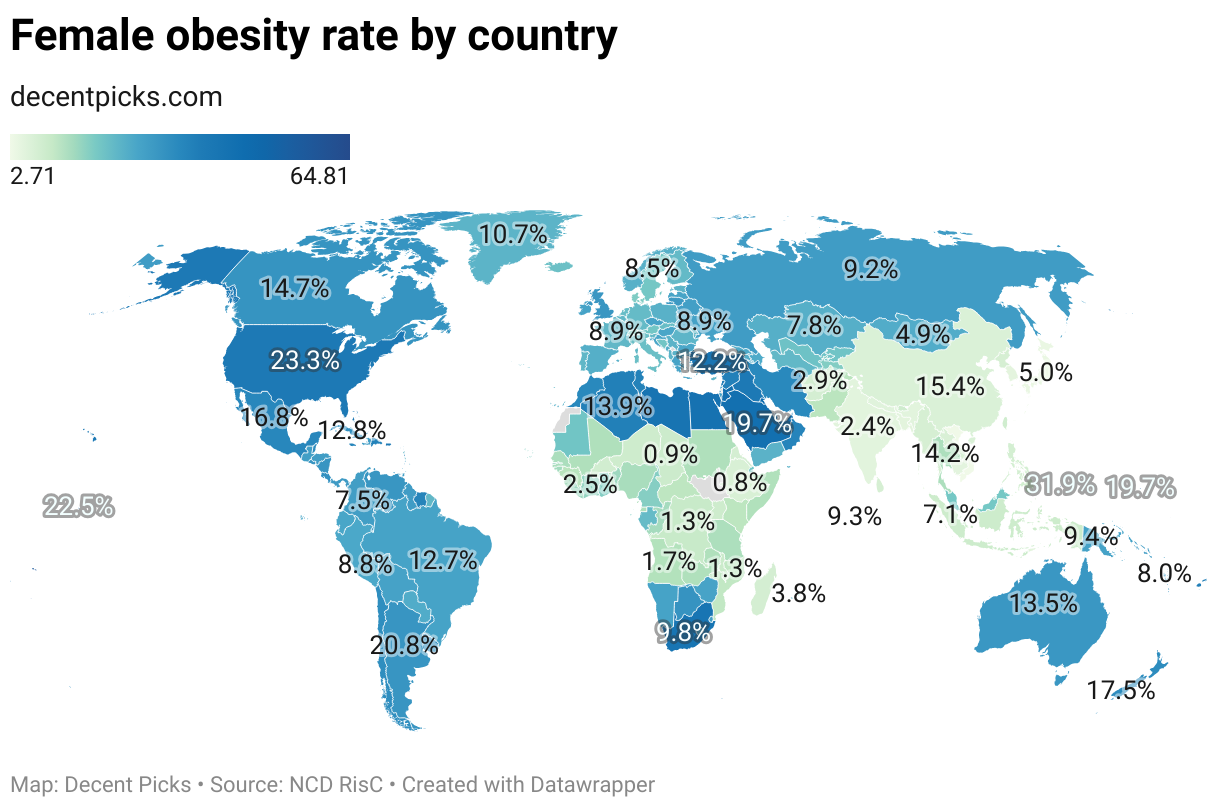
For Adult Women
- American Samoa leads with an astounding 65.32% obesity rate.
- Next in line are Nauru, the Cook Islands, and Palau, all with figures over 60%.
- The U.S. sees its adult female population with an obesity rate of 38.16% (slightly higher than the males), ranking 30th out of 200 surveyed regions.
- Canada is at 30.47%, landing in the 54th spot.
- Vietnam again boasts the lowest rate at 2.71%, with Japan, South Korea, Cambodia, and Timor-Leste following suit.

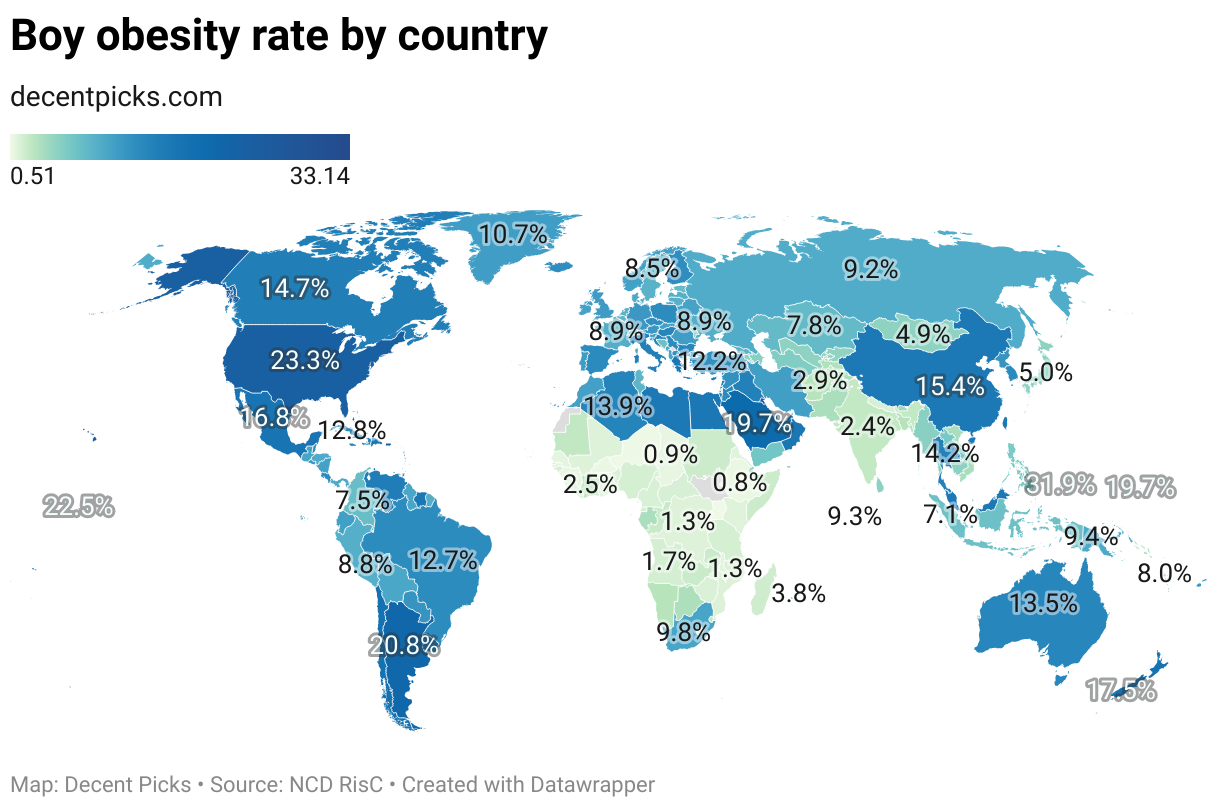
For Boys
- The Cook Islands lead with 33.30%.
- Nauru, Palau, Niue, and American Samoa trail behind.
- The U.S. is at 23.29%, ranking 12th.
- Canada reports 14.73%, standing at 44th.
- Uganda has the lowest at 0.51%, followed by Rwanda, Niger, Burkina Faso, and Ethiopia.
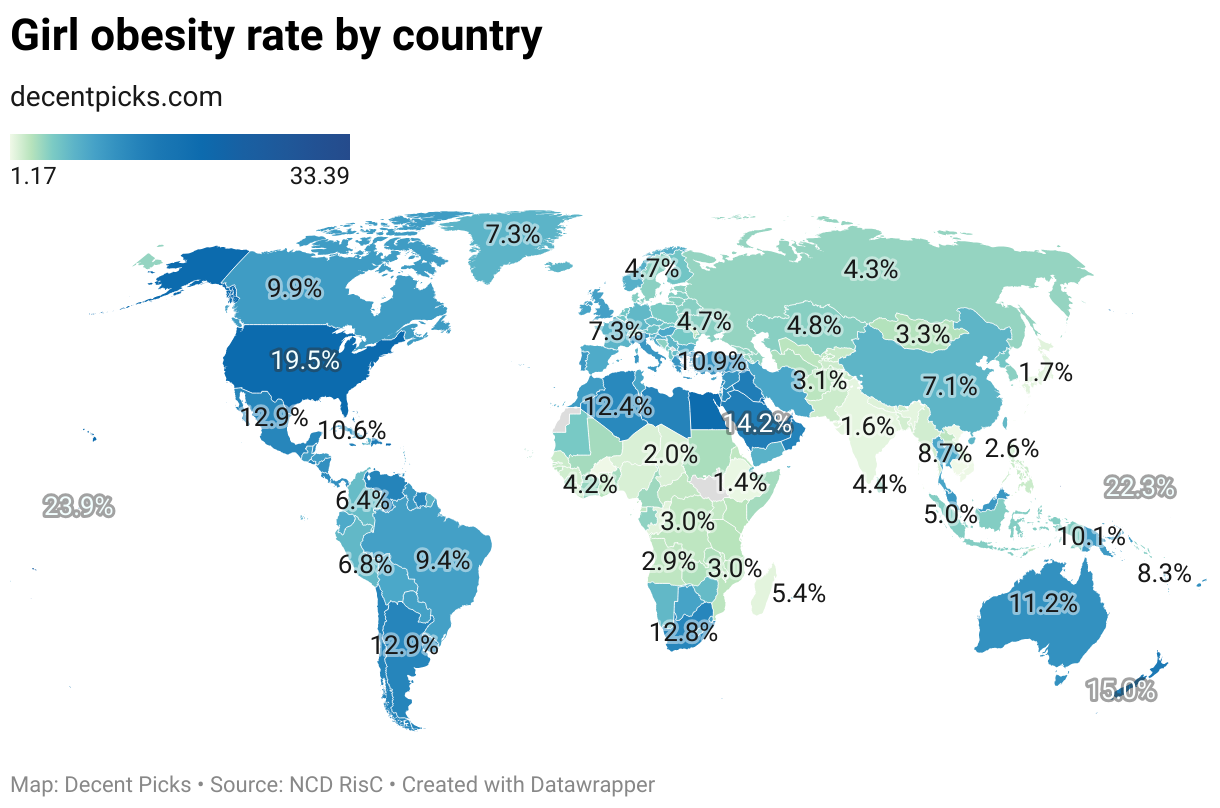
For Girls
- Nauru leads with 33.39%.
- Following are the Cook Islands, Palau, Tonga, and Tuvalu.
- The U.S. records 19.47%, coming in 15th.
- Canada is at 9.92%, ranking 67th.
- Cambodia has the least at 1.17%, with Burkina Faso, Vietnam, Ethiopia, and India right behind.

Trusted Website NCBI, US National Center for Biotechnology Information, is a trusted source of biotechnology and biomedicine information. Open the link →
Disclosure: We are an Amazon Associate. Some links on this website are affiliate links, which means we may earn a commission or receive a referral fee when you sign up or make a purchase through those links.
Related Posts
 States with the Highest and Lowest Obesity Rates in the U.S.

- America’s Most Aged States with the Highest Life Expectancy and Low Fertility Rates
- Countries with the Most Aged Populations
- Which States Have the Lowest Sales Tax?
- America’s Popular College Majors and Their Changes Over the Last Decade
- The World’s Wealthiest Countries in 2023
 The U.S. Senators Are Aged


Leave a Reply