The United States has two national data systems to collect information on homicide:
- Federal Bureau of Investigation’s Supplementary Homicide Reports
- Centers for Disease Control and Prevention’s Fatal Injury Reports
FBI’s Supplementary Homicide Reports
The FBI’s Uniform Crime Report (UCR) has been gathering crime data from U.S. law enforcement agencies since 1930. Each month, most states’ law enforcement agencies compile and send this data to the FBI.
Beginning in the 1960s, the FBI started including more specific details about murders within the UCR. This led to the creation of the Supplementary Homicide Reports, which detail aspects like the jurisdiction, date, demographics of those involved, weapons used, the context, and the relationship between the victim and offender, among other information.

Reporting crimes to the FBI is not mandatory. The Department of Justice has complained that many law enforcement agencies either do not submit data from the Supplementary Homicide Reports regularly or not at all.
The report captures crime summaries only from state and local jurisdictions. It does not include cases handled by federal agencies, like those occurring in federal prisons, military bases, and Indian reservations.
It’s also worth noting that the details in the Supplementary Homicide Reports are based on initial police investigations. They do not reflect subsequent legal actions, including charges or court verdicts.
Typically, the Uniform Crime Report is published around six months after the end of the year. The Supplementary Homicide Reports, which rely on the UCR’s data, usually takes another six months to complete.
CDC’s Fatal Injury Reports
The CDC’s Fatal Injury Reports originate from the National Vital Statistics System (NVSS). Initiated in the 1930s, the NVSS gathers birth and death registration data from every state.
It’s mandated by law for coroners or medical examiners to examine all homicides and unexpected deaths. In instances of homicide, they usually fill out the medical section of the death certificate, including the cause of death. This certificate is then forwarded to the state’s vital statistics department and subsequently categorized and relayed to the CDC.

The CDC’s Fatal Injury Reports and the FBI’s Supplementary Homicide Reports serve different purposes and collect distinct sets of data. For example, the CDC’s reports do not include any details about suspects or the nature of their relationship to the victims.
Another important difference is:
- State and local law enforcement agencies can choose whether or not to report homicides to the FBI (and many either report inconsistently or not at all),
- Reporting deaths to the CDC via state vital statistics offices is mandatory by law. As such, the CDC’s data may offer a more thorough picture than that of the FBI.
The Fatal Injury Reports are typically released about two years after the year ends. The latest data released in 2023 pertains to the year 2021 and is accessible on the CDC’s website.
Brief comparison of the two reports
| CDC Report | FBI Report | |
|---|---|---|
| Purpose | Track all deaths | Track crime statistics |
| Source | State vital registrars | Law enforcement agencies |
| Initial report | Death certificate | Police report |
| Reporting responsibility | Coroner/Medical examiner | Law enforcement officers |
| Definition of homicide | Injuries inflicted with intent to injure or kill | Murders & nonnegligent manslaughters |
| Reporting is | Mandatory | Voluntary |
| Data collection | Cause of death is confirmed by a coroner | Voluntary compilation by the police |
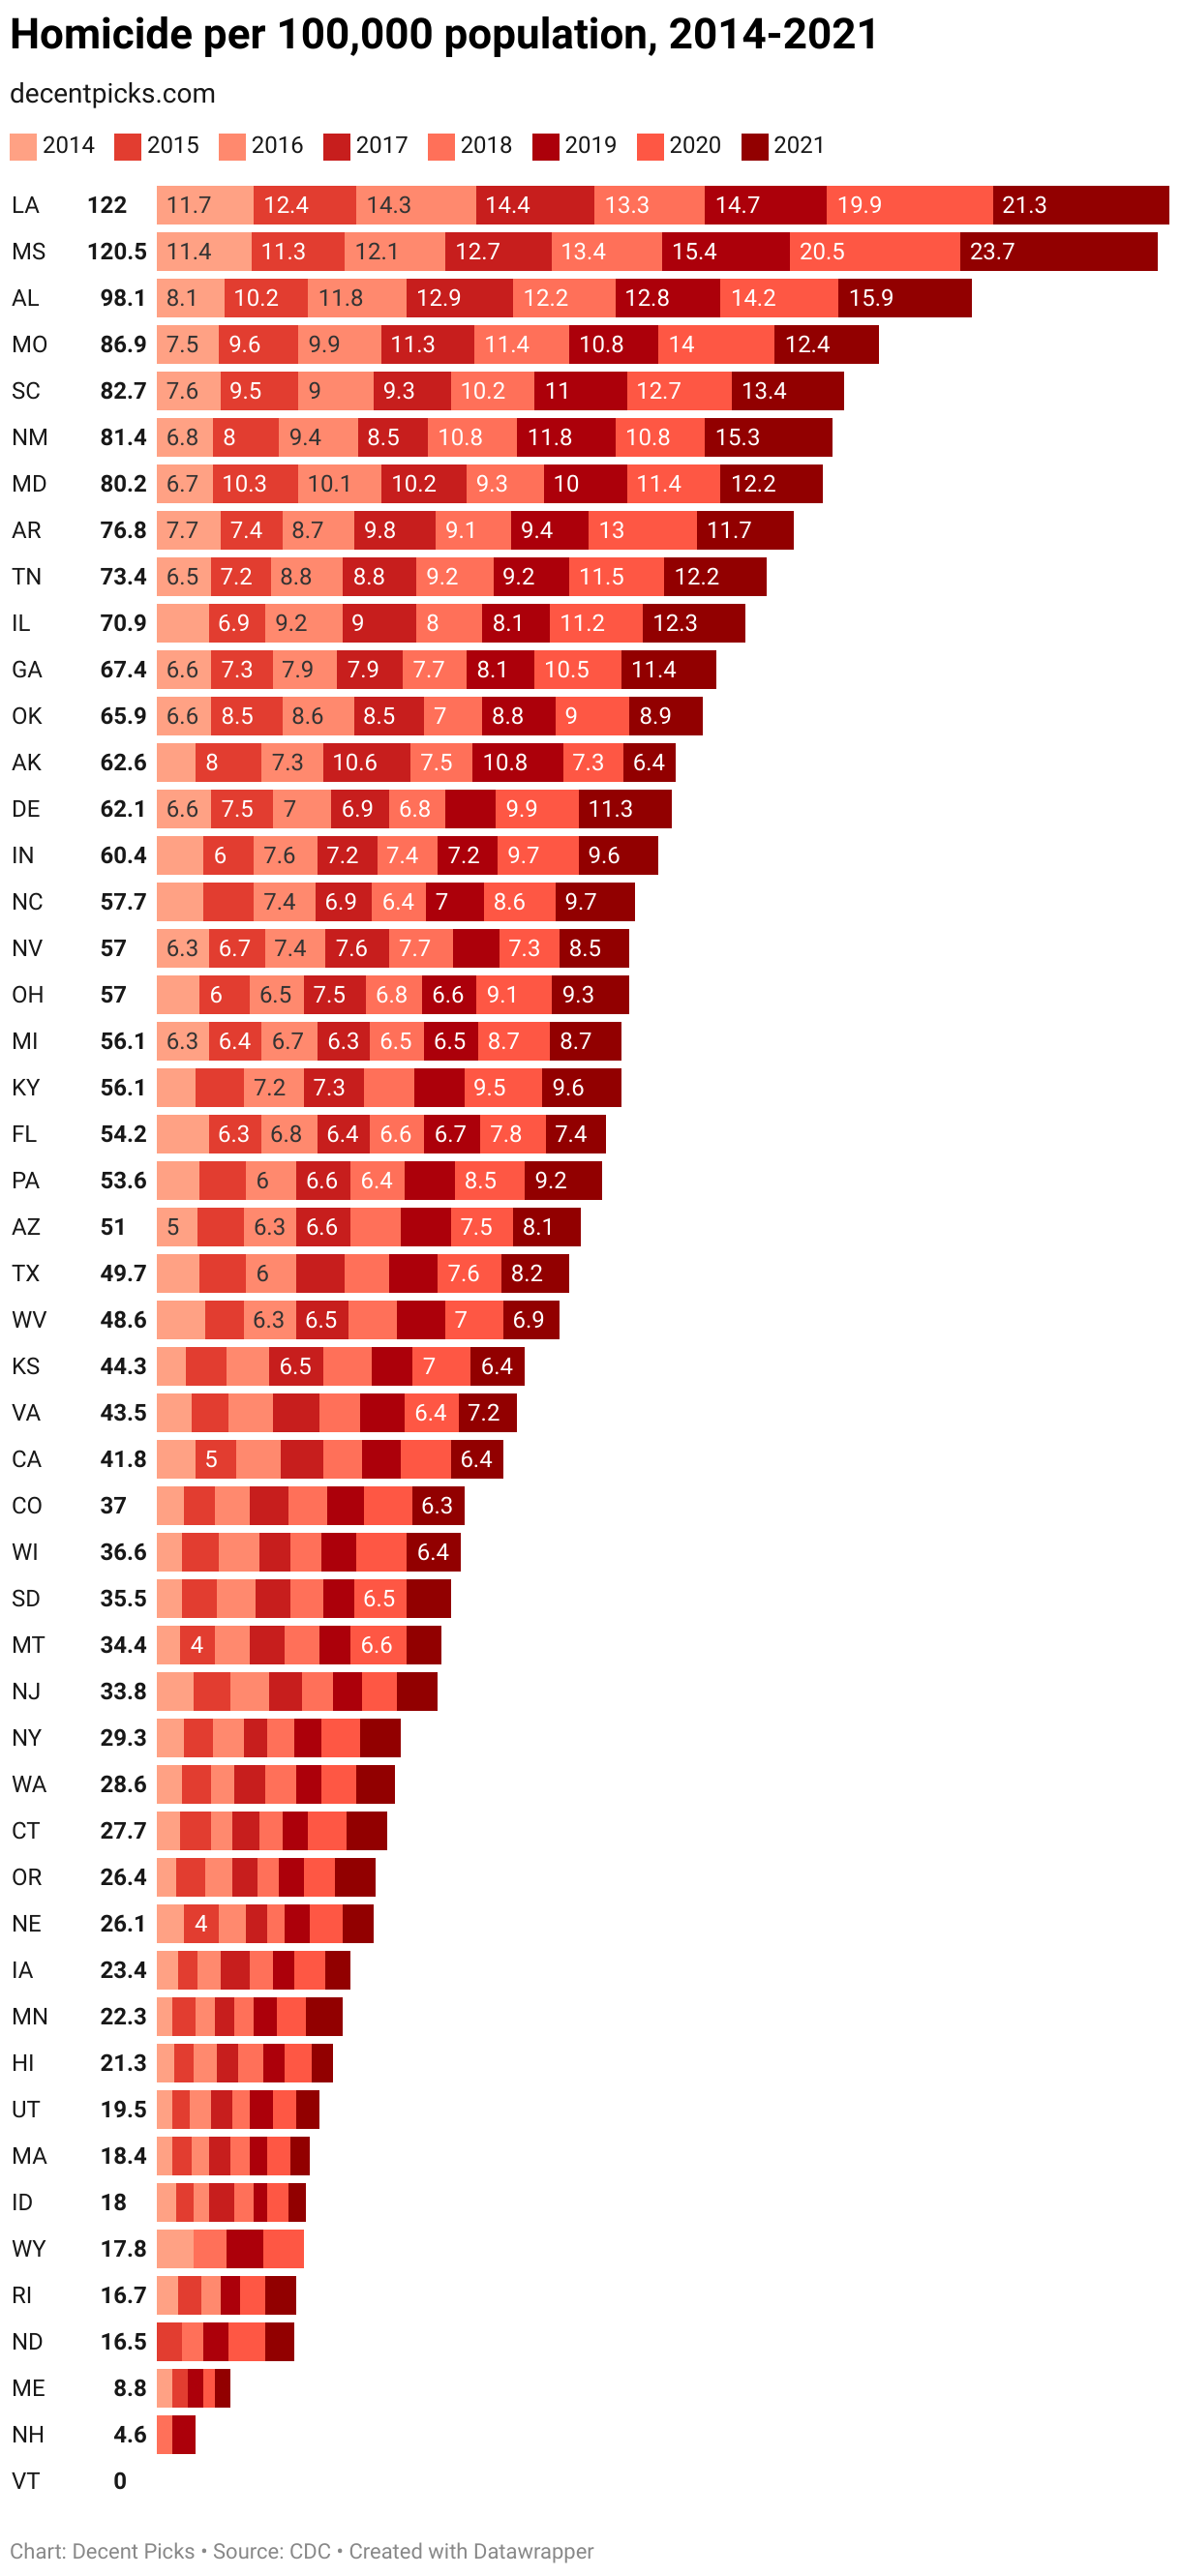
Below are the figures I’ve compiled from the CDC’s Fatal Injury Reports for the past 8 years. Vermont and several other states didn’t have recorded homicide rates for some years. The CDC table lists them as 0, but that doesn’t mean there were no homicides at all.
For instance, in 2021, three states had a homicide rate of 0, but each had a small number of homicides: New Hampshire with 15, Vermont with 10, and Wyoming with 16. Interestingly, these three states represent a political spectrum: New Hampshire being a swing state, Vermont a blue state, and Wyoming a red state.
Occurrences where states register a “0” homicide rate are rare, and when they do occur, the actual number of homicides tends to be minimal.
Homicide statistics by state from 2014-2021
The table below includes the homicide rates per 100,000 population for each state from 2014-2021, as well as the average homicide rate in the 8 years. It also includes the results of the 2016 and 2020 presidential elections (D for Democrat and R for Republican). The categorization of states as red, blue, and swing is as follows:
- Blue states: Those where the Democratic Party won by more than 5 points in both the 2016 and 2020 elections.
- Red states: Those where the Republican Party won by more than 5 points in both elections.
- Swing states: All other states that don’t fit into the aforementioned categories.
Overall, the homicide rate in red states seems significantly higher than in blue states.
The table initially displays the average homicide rate over the 8-year period, along with the 2020 election results, sorting from highest to lowest rates. You can check or uncheck years and data points to view more metrics, or click on the table header to rearrange the data.
Homicide rates by state from 2014-2021
State 2014 2015 2016 2017 2018 2019 2020 2021 Average 2016 Election 2020 Election Status AL 8.1 10.2 11.8 12.9 12.2 12.8 14.2 15.9 12.3 D 34% – R 62% D 37% – R 62% Red AK 4.7 8 7.3 10.6 7.5 10.8 7.3 6.4 7.8 D 37% – R 51% D 43% – R 53% Red AZ 5 5.5 6.3 6.6 6.1 5.9 7.5 8.1 6.4 D 45% – R 48% D 49% – R 49% Swing AR 7.7 7.4 8.7 9.8 9.1 9.4 13 11.7 9.6 D 34% – R 61% D 35% – R 62% Red CA 4.6 5 5.3 5.1 4.8 4.5 6 6 5.2 D 62% – R 32% D 63% – R 34% Blue CO 3.3 3.7 4.3 4.6 4.7 4 6 6.3 4.6 D 48% – R 43% D 55% – R 42% Swing CT 2.9 3.6 2.7 3.2 2.8 3.1 4.6 4.8 3.5 D 55% – R 41% D 59% – R 39% Blue DE 6.6 7.5 7 6.9 6.8 6.1 9.9 11.3 7.8 D 53% – R 42% D 59% – R 40% Blue FL 6.2 6.3 6.8 6.4 6.6 6.7 8 7 6.8 D 48% – R 49% D 48% – R 51% Swing GA 6.6 7.3 7.9 7.9 7.7 8 11 11 8.4 D 46% – R 51% D 49% – R 49% Swing HI 2.2 2.2 2.8 2.5 3.1 2.5 3.3 2.7 2.7 D 62% – R 30% D 64% – R 34% Blue ID 2.4 2 1.9 3 2.3 1.7 2.5 2.2 2.3 D 27% – R 59% D 33% – R 64% Red IL 6.2 6.9 9.2 9 8 8.1 11.2 12 8.9 D 56% – R 39% D 58% – R 41% Blue IN 5.7 6 7.6 7.2 7.4 7 10 9.6 7.6 D 38% – R 57% D 41% – R 57% Red IA 2.5 2.5 2.8 3.4 2.7 2.7 3.6 3.2 2.9 D 42% – R 51% D 45% – R 53% Red KS 3.6 4.7 5.3 6.5 5.9 4.9 7 6.4 5.5 D 36% – R 57% D 42% – R 56% Red KY 4.7 5.8 7.2 7.3 6.1 5.9 9.5 9.6 7.0 D 33% – R 63% D 36% – R 62% Red LA 11.7 12.4 14.3 14.4 13.3 14.7 19.9 21.3 15.3 D 38% – R 58% D 40% – R 58% Red ME 2 1.7 0 0 0 1.8 1.6 1.7 1.1 D 48% – R 45% D 53% – R 44% Swing MD 6.7 10.3 10.1 10.2 9.3 10 11.4 12.2 10.0 D 60% – R 34% D 65% – R 32% Blue MA 2 2.1 2.1 2.6 2.3 2.3 2.7 2.3 2.3 D 60% – R 33% D 66% – R 32% Blue MI 6.3 6.4 6.7 6.3 6.5 6.5 8.7 8.7 7.0 D 47% – R 48% D 51% – R 48% Swing MN 1.9 2.8 2.4 2.2 2.3 2.8 3.6 4.3 2.8 D 46% – R 45% D 52% – R 45% Swing MS 11.4 11.3 12.1 12.7 13.4 15.4 20.5 23.7 15.1 D 40% – R 58% D 41% – R 58% Red MO 7.5 9.6 9.9 11.3 11.4 10.8 14 12.4 10.9 D 38% – R 57% D 41% – R 57% Red MT 2.9 4 4.3 4.3 4.2 3.7 6.6 4.4 4.3 D 36% – R 56% D 41% – R 57% Red NE 3.4 4 3.3 2.7 1.9 3.1 4.1 3.6 3.3 D 34% – R 59% D 39% – R 58% Red NV 6.3 6.7 7.4 7.6 7.7 5.5 7.3 8.5 7.1 D 48% – R 46% D 50% – R 48% Swing NH 0 0 0 0 1.8 2.8 0 0 0.6 D 47% – R 47% D 53% – R 45% Swing NJ 4.4 4.5 4.6 4.1 3.7 3.4 4.3 4.8 4.2 D 55% – R 41% D 57% – R 41% Blue NM 6.8 8 9.4 8.5 10.8 11.8 10.8 15.3 10.2 D 48% – R 40% D 54% – R 44% Blue NY 3.4 3.4 3.6 3 3.2 3.2 4.7 4.8 3.7 D 59% – R 37% D 61% – R 38% Blue NC 5.6 6.1 7.4 6.9 6.4 7 8.6 9.7 7.2 D 46% – R 50% D 49% – R 50% Swing ND 0 3.1 0 0 2.5 3.1 4.4 3.4 2.1 D 27% – R 63% D 32% – R 65% Red OH 5.2 6 6.5 7.5 6.8 6.6 9.1 9 7.1 D 44% – R 52% D 45% – R 53% Red OK 6.6 8.5 8.6 8.5 7 8.8 9 8.9 8.2 D 29% – R 65% D 32% – R 65% Red OR 2.4 3.4 3.3 3.1 2.5 3 3.8 4.9 3.3 D 50% – R 39% D 56% – R 40% Blue PA 5.2 5.6 6 6.6 6.4 6.1 8.5 9.2 6.7 D 47% – R 48% D 50% – R 49% Swing RI 2.5 2.8 2.3 0 0 2.5 3 3.6 2.1 D 54% – R 39% D 59% – R 39% Blue SC 7.6 9.5 9 9.3 10.2 11 12.7 13.4 10.3 D 41% – R 55% D 43% – R 55% Red SD 3.1 4.2 4.7 4.2 3.9 3.6 6.5 5.3 4.4 D 32% – R 62% D 36% – R 62% Red TN 6.5 7.2 8.8 8.8 9.2 9.2 11.5 12.2 9.2 D 35% – R 61% D 37% – R 61% Red TX 5.2 5.6 6 5.8 5.4 5.9 8 8 6.2 D 43% – R 52% D 46% – R 52% Red UT 2 2 2.5 2.6 2.2 3 3 2.7 2.4 D 27% – R 46% D 38% – R 58% Red VT 0 0 0 0 0 0 0 0 0.0 D 57% – R 30% D 66% – R 31% Blue VA 4.1 4.5 5.5 5.4 5.1 5.3 6.4 7.2 5.4 D 50% – R 44% D 54% – R 44% Blue WA 3.1 3.4 2.9 3.6 3.7 3.2 4.2 4.5 3.6 D 53% – R 37% D 58% – R 39% Blue WV 5.9 4.5 6.3 6.5 5.8 5.7 7 6.9 6.1 D 26% – R 69% D 30% – R 69% Red WI 3 4.5 4.8 3.7 3.9 4.2 6.1 6.4 4.6 D 46% – R 47% D 49% – R 49% Swing WY 4.4 0 0 0 4.1 4.4 4.9 0 2.2 D 22% – R 68% D 27% – R 70% Red
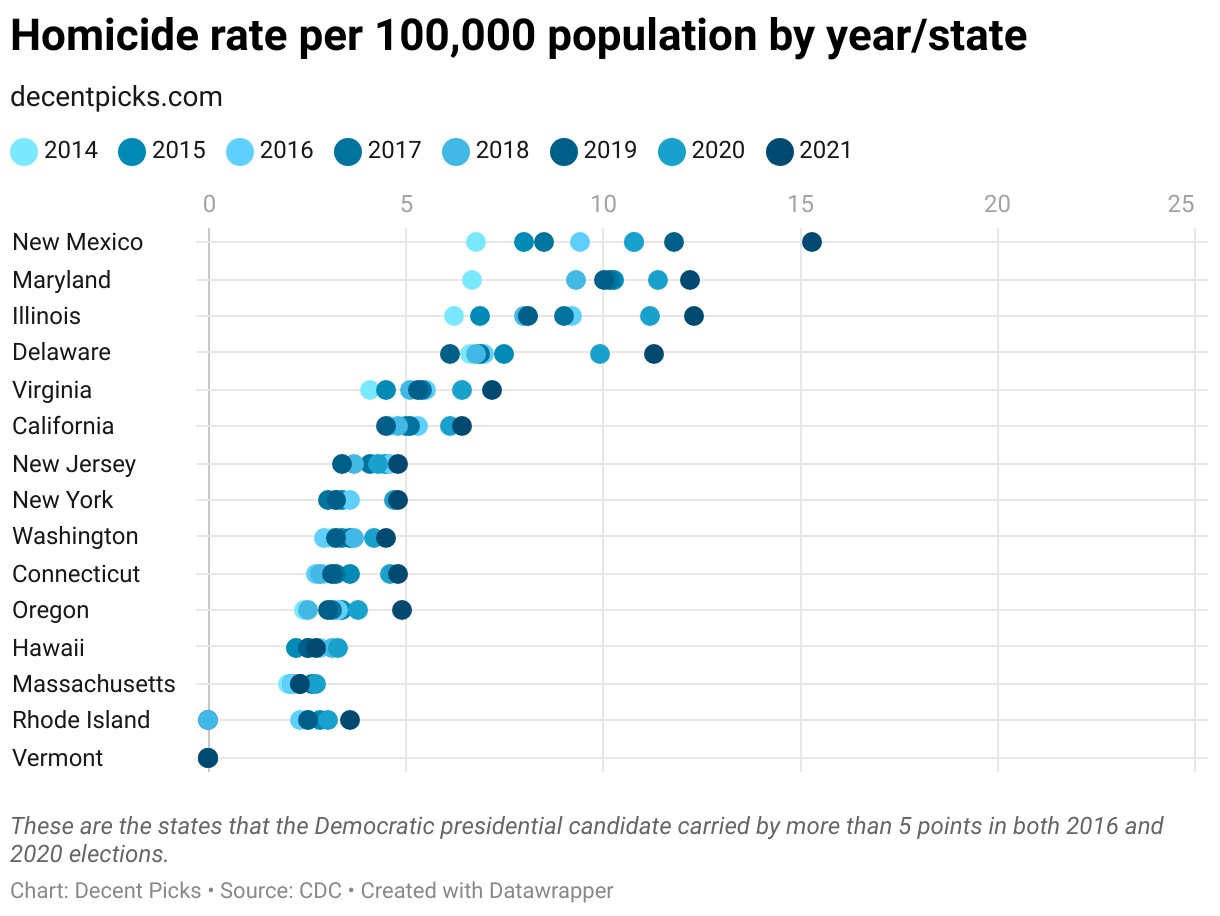
Homicide rate in blue states
Below is the homicide rate for 15 blue states. For a fair comparison, the following blue, red, and swing state graphs all use the same scale, ranging from 0 to 25 per 100,000 population.
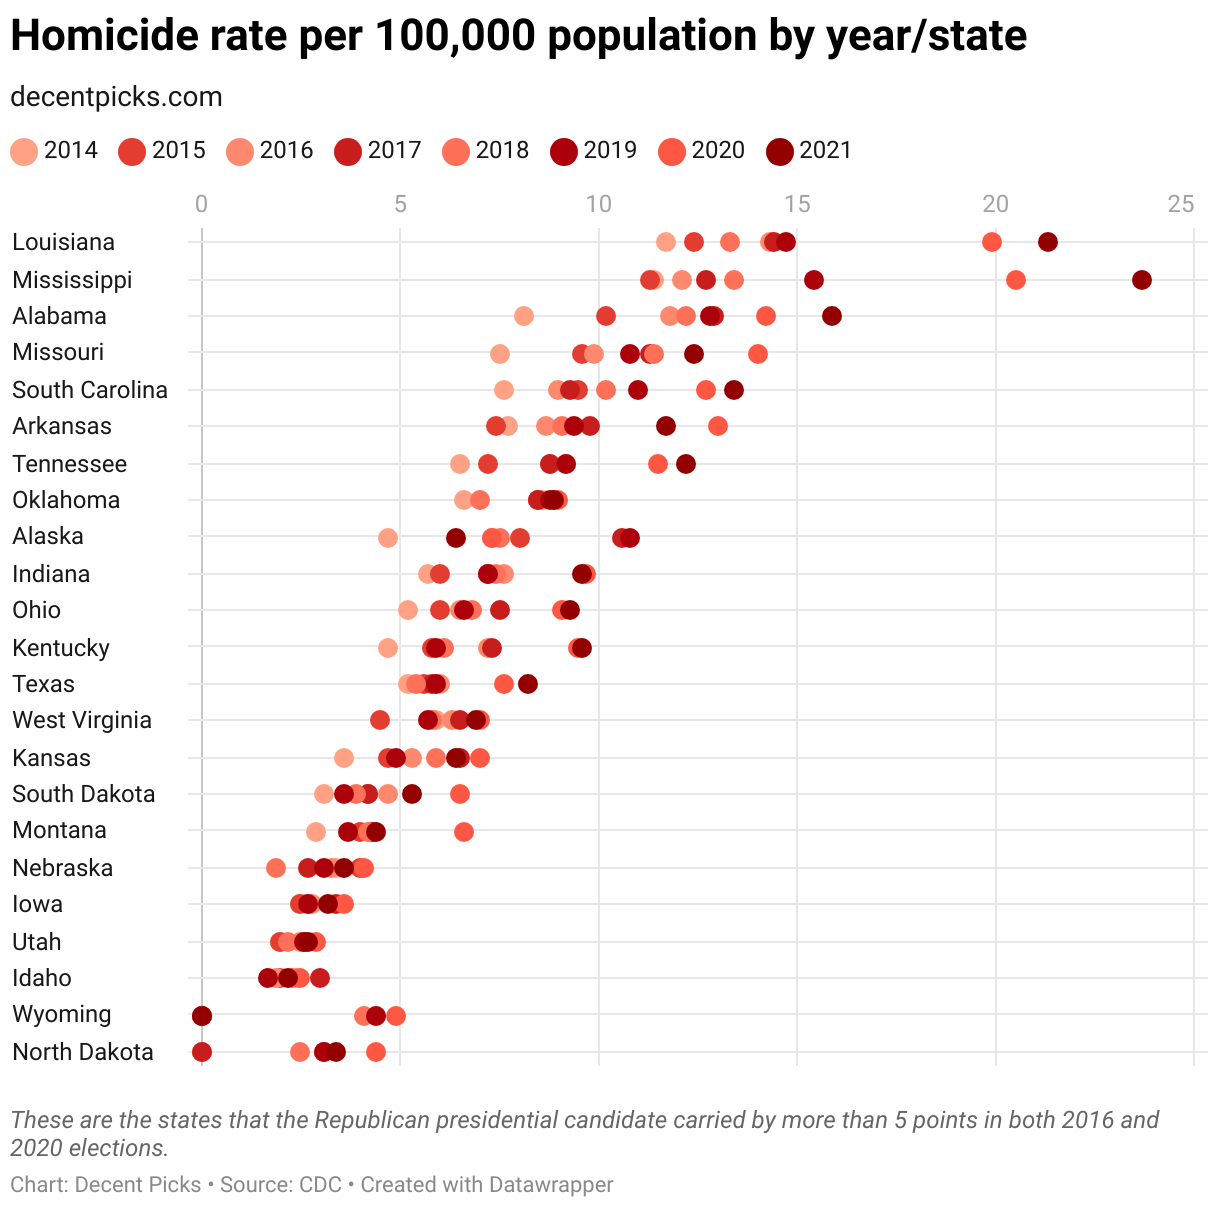
Homicide rate in red states
Below are 23 red states. Rate is per 100,000 population.
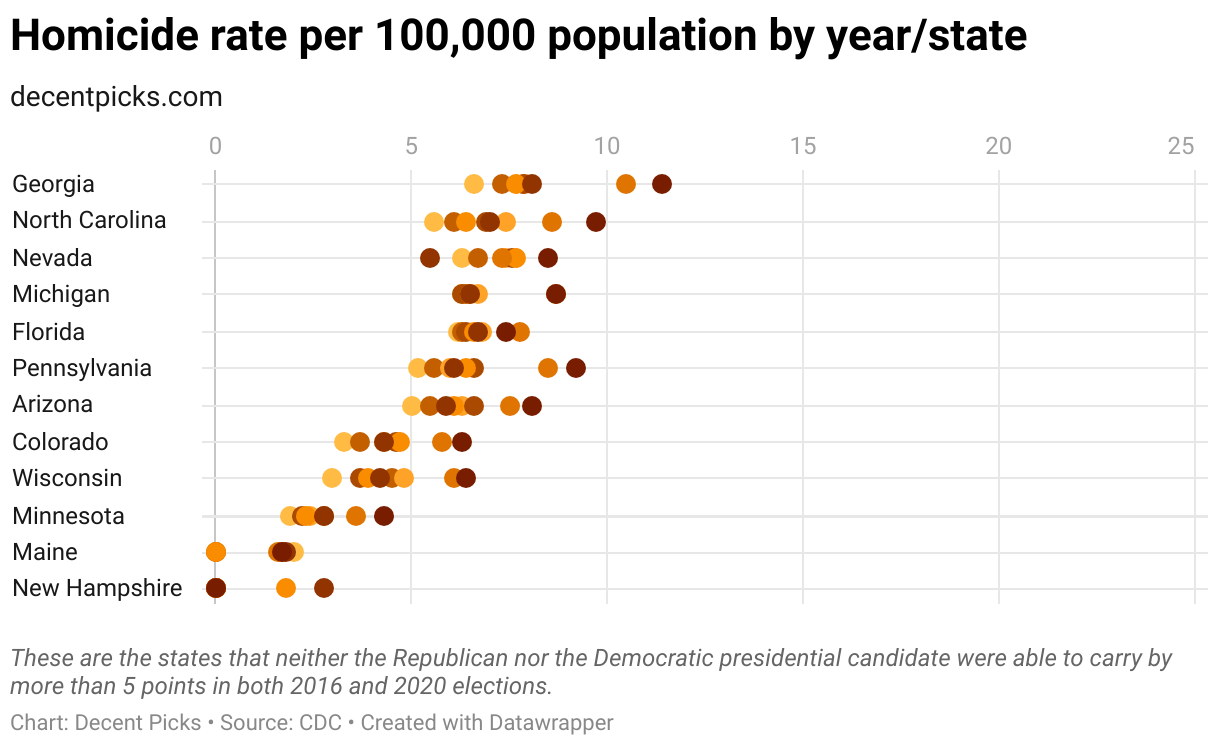
Homicide rate in swing states
Here are 12 states identified as swing states. Take Florida as an example: despite Trump’s victories in both elections, his margins were 1.20 and 3.36 points, each below the 5 percentage point threshold. Therefore, for the purposes of this article, Florida is categorized as a “swing state.”
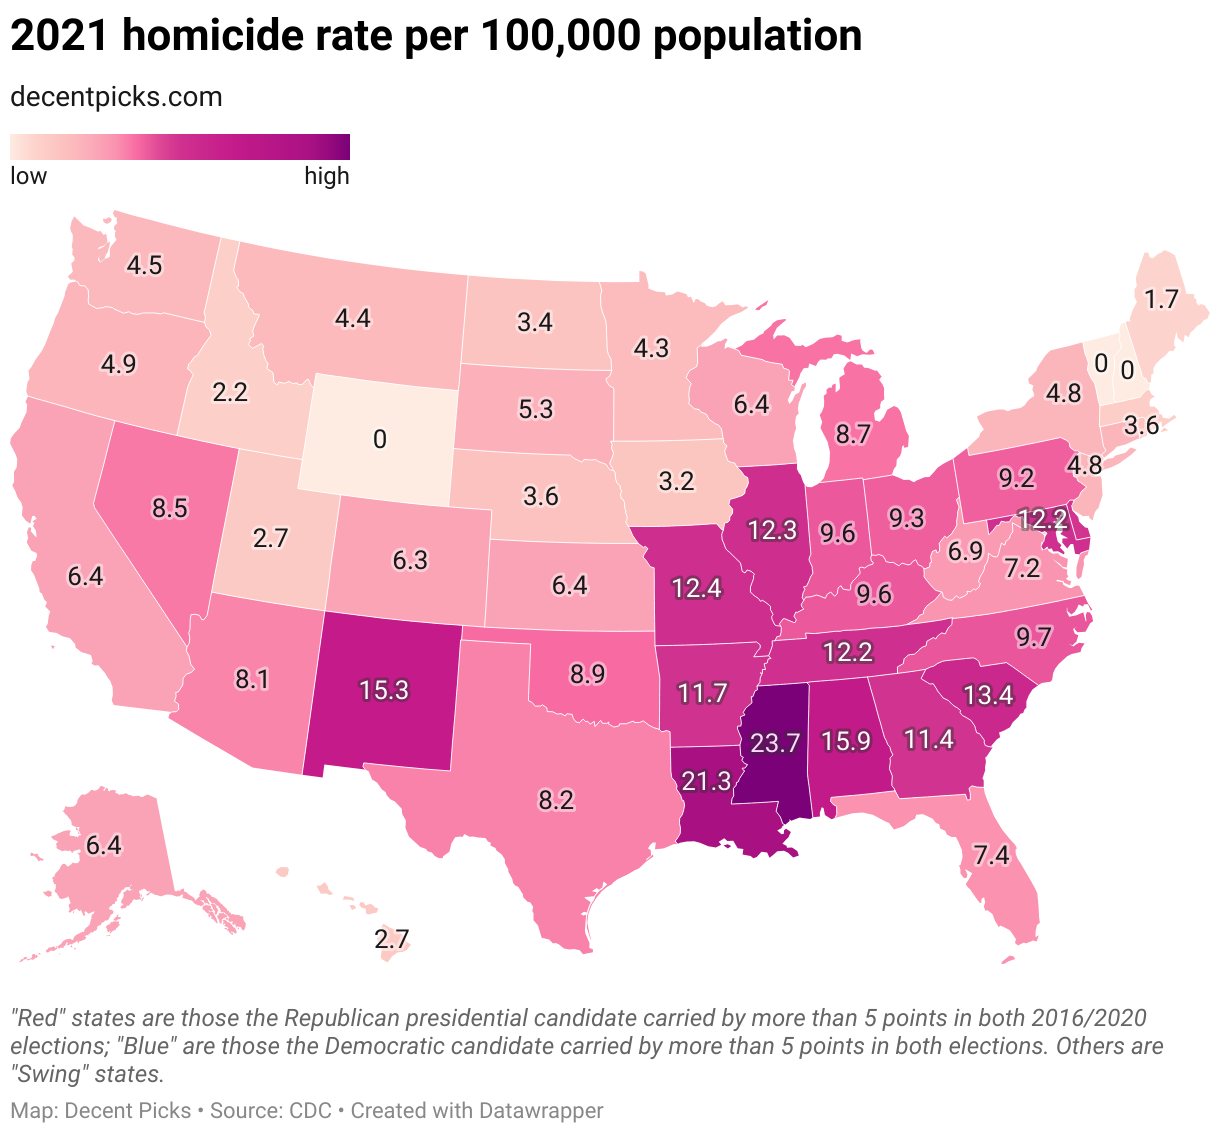
2021 homicide rate map by state
As previously mentioned, the CDC’s 2021 report recorded a homicide rate of 0 for three states. However, in reality, these states did experience a few homicides: Wyoming had 16, Vermont 10, and New Hampshire 15. Each of these figures represents a relatively low homicide rate.
Homicide rate over 8 years by state
The rates are calculated based on a 100,000 population. When viewed over an 8-year period, the disparity becomes remarkably pronounced.
Disclosure: We are an Amazon Associate. Some links on this website are affiliate links, which means we may earn a commission or receive a referral fee when you sign up or make a purchase through those links.
Related Posts
 America’s Most Aged States with the Highest Life Expectancy and Low Fertility Rates
 Countries with the Most Aged Populations
- Which States Have the Lowest Sales Tax?
- America’s Popular College Majors and Their Changes Over the Last Decade
- America’s Growing Challenge with Gun Violence
- Electric Vehicle Sales and Market Share in the U.S.
- States with the Highest and Lowest Obesity Rates in the U.S.
- Best & Worst College Majors in the U.S. for High-Paying & Stable Jobs
- The World’s Wealthiest Countries in 2023
 The U.S. Senators Are Aged
- Ranking the Most and Least Obese Countries in the World


Leave a Reply