According to the 2020 census, there were 18.43 million Asians in the U.S., making up about 7% of the nation’s total population. A projection by the Pew Research Center suggests that by 2055, Asians will surpass Latinos to become the leading immigrant group in the U.S. By 2060, the Asian-American population is expected to reach 46 million.
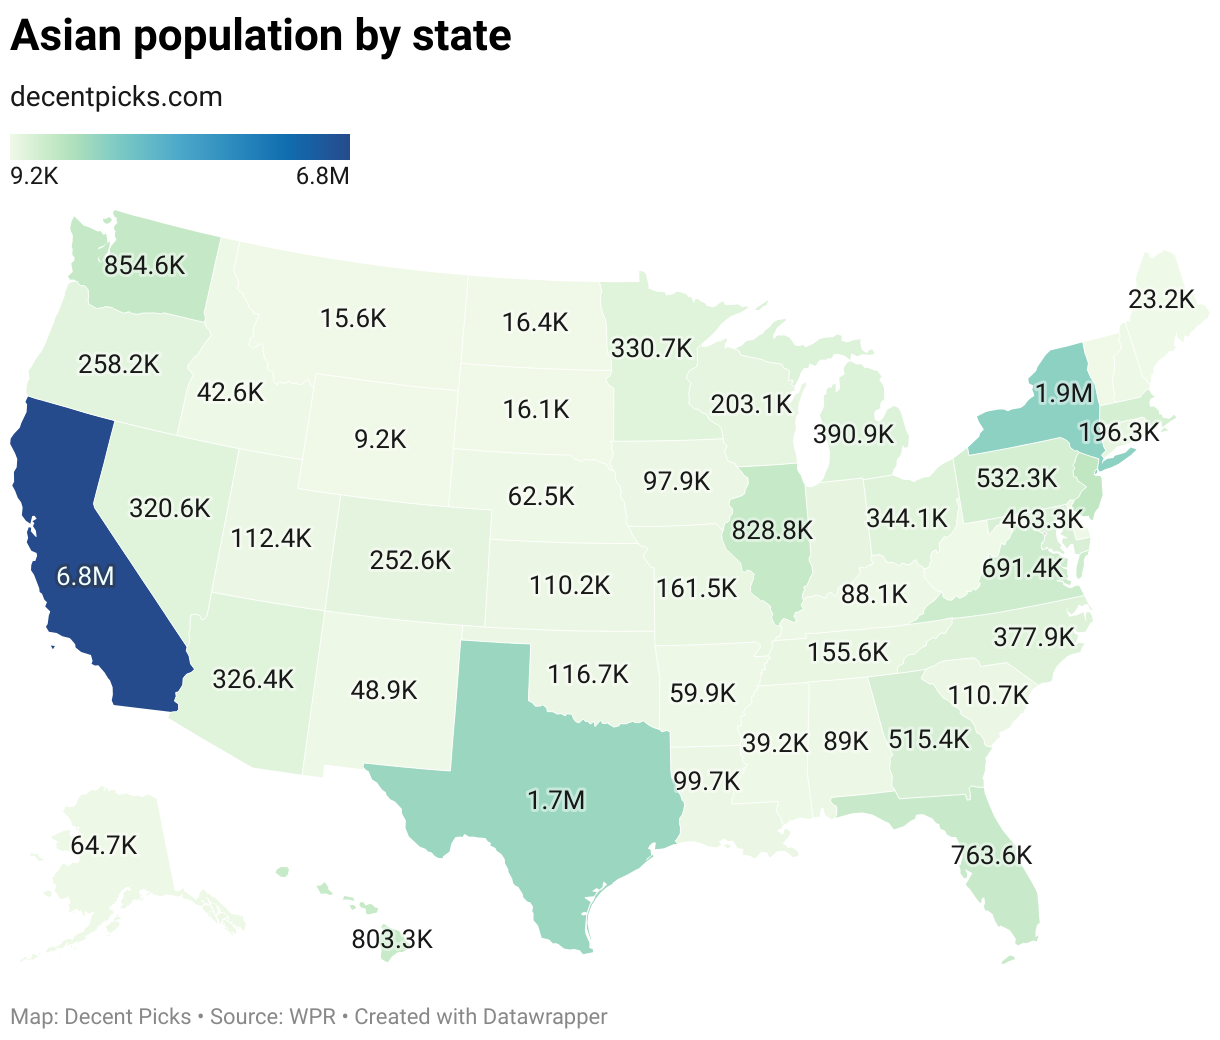
California has the largest Asian population, boasting a whopping 6.8 million. New York follows with 1.9 million, and Texas with 1.7 million.
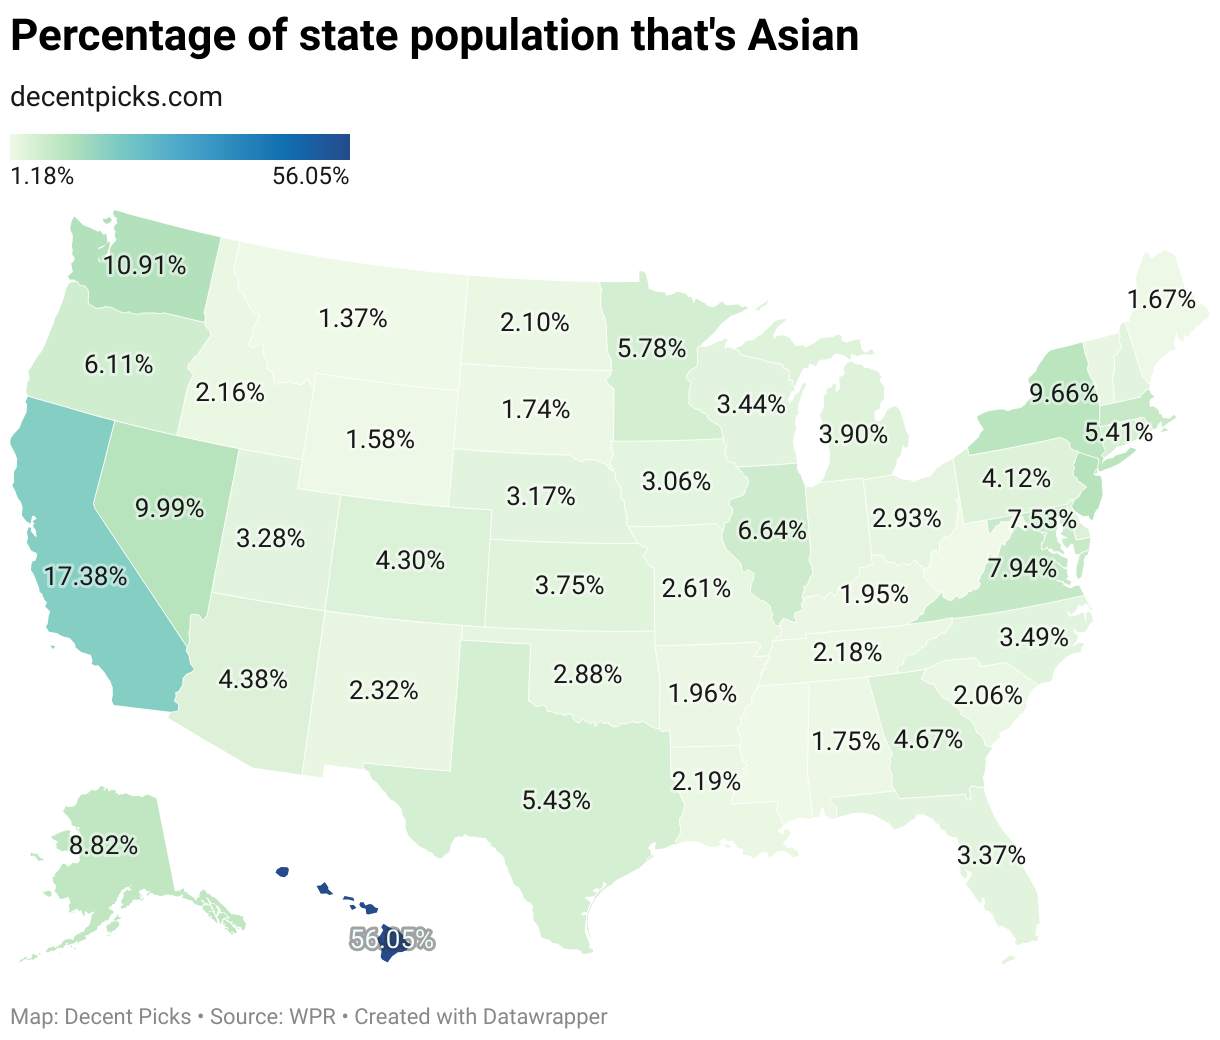
In terms of the percentage of Asians relative to a state’s total population, Hawaii leads the pack with an impressive 56%. It’s followed by California at 17.38% and New Jersey at 10.25%.
The top ten states with the highest Asian populations are: California, New York, Texas, New Jersey, Washington, Illinois, Hawaii, Florida, Virginia, and Massachusetts.
Asian Populations by State
| State | Asian Population | % of state population | % of U.S. Asian population | State Full |
|---|---|---|---|---|
| CA | 6,764,118 | 17.38% | 30.48% | California |
| NY | 1,884,346 | 9.66% | 8.49% | New York |
| TX | 1,656,166 | 5.43% | 7.46% | Texas |
| NJ | 948,998 | 10.25% | 4.28% | New Jersey |
| WA | 854,617 | 10.91% | 3.85% | Washington |
| IL | 828,847 | 6.64% | 3.73% | Illinois |
| HI | 803,266 | 56.05% | 3.62% | Hawaii |
| FL | 763,613 | 3.37% | 3.44% | Florida |
| VA | 691,449 | 7.94% | 3.12% | Virginia |
| MA | 538,409 | 7.72% | 2.43% | Massachusetts |
| PA | 532,335 | 4.12% | 2.40% | Pennsylvania |
| GA | 515,434 | 4.67% | 2.32% | Georgia |
| MD | 463,308 | 7.53% | 2.09% | Maryland |
| MI | 390,937 | 3.90% | 1.76% | Michigan |
| NC | 377,854 | 3.49% | 1.70% | North Carolina |
| OH | 344,131 | 2.93% | 1.55% | Ohio |
| MN | 330,738 | 5.78% | 1.49% | Minnesota |
| AZ | 326,446 | 4.38% | 1.47% | Arizona |
| NV | 320,596 | 9.99% | 1.44% | Nevada |
| OR | 258,188 | 6.11% | 1.16% | Oregon |
| CO | 252,624 | 4.30% | 1.14% | Colorado |
| WI | 203,052 | 3.44% | 0.91% | Wisconsin |
| CT | 196,347 | 5.41% | 0.88% | Connecticut |
| IN | 195,087 | 2.85% | 0.88% | Indiana |
| MO | 161,495 | 2.61% | 0.73% | Missouri |
| TN | 155,558 | 2.18% | 0.70% | Tennessee |
| OK | 116,701 | 2.88% | 0.53% | Oklahoma |
| UT | 112,368 | 3.28% | 0.51% | Utah |
| SC | 110,663 | 2.06% | 0.50% | South Carolina |
| KS | 110,231 | 3.75% | 0.50% | Kansas |
| LA | 99,667 | 2.19% | 0.45% | Louisiana |
| IA | 97,896 | 3.06% | 0.44% | Iowa |
| AL | 89,031 | 1.75% | 0.40% | Alabama |
| KY | 88,096 | 1.95% | 0.40% | Kentucky |
| AK | 64,669 | 8.82% | 0.29% | Alaska |
| NE | 62,516 | 3.17% | 0.28% | Nebraska |
| AR | 59,949 | 1.96% | 0.27% | Arkansas |
| NM | 48,942 | 2.32% | 0.22% | New Mexico |
| NH | 47,713 | 3.40% | 0.21% | New Hampshire |
| DE | 45,744 | 4.43% | 0.21% | Delaware |
| RI | 45,472 | 4.17% | 0.20% | Rhode Island |
| ID | 42,595 | 2.16% | 0.19% | Idaho |
| MS | 39,237 | 1.34% | 0.18% | Mississippi |
| DC | 37,847 | 5.61% | 0.17% | District of Columbia, Washington DC |
| ME | 23,244 | 1.67% | 0.10% | Maine |
| WV | 20,784 | 1.18% | 0.09% | West Virginia |
| ND | 16,362 | 2.10% | 0.07% | North Dakota |
| SD | 16,062 | 1.74% | 0.07% | South Dakota |
| MT | 15,622 | 1.37% | 0.07% | Montana |
| VT | 14,972 | 2.31% | 0.07% | Vermont |
| WY | 9,194 | 1.58% | 0.04% | Wyoming |
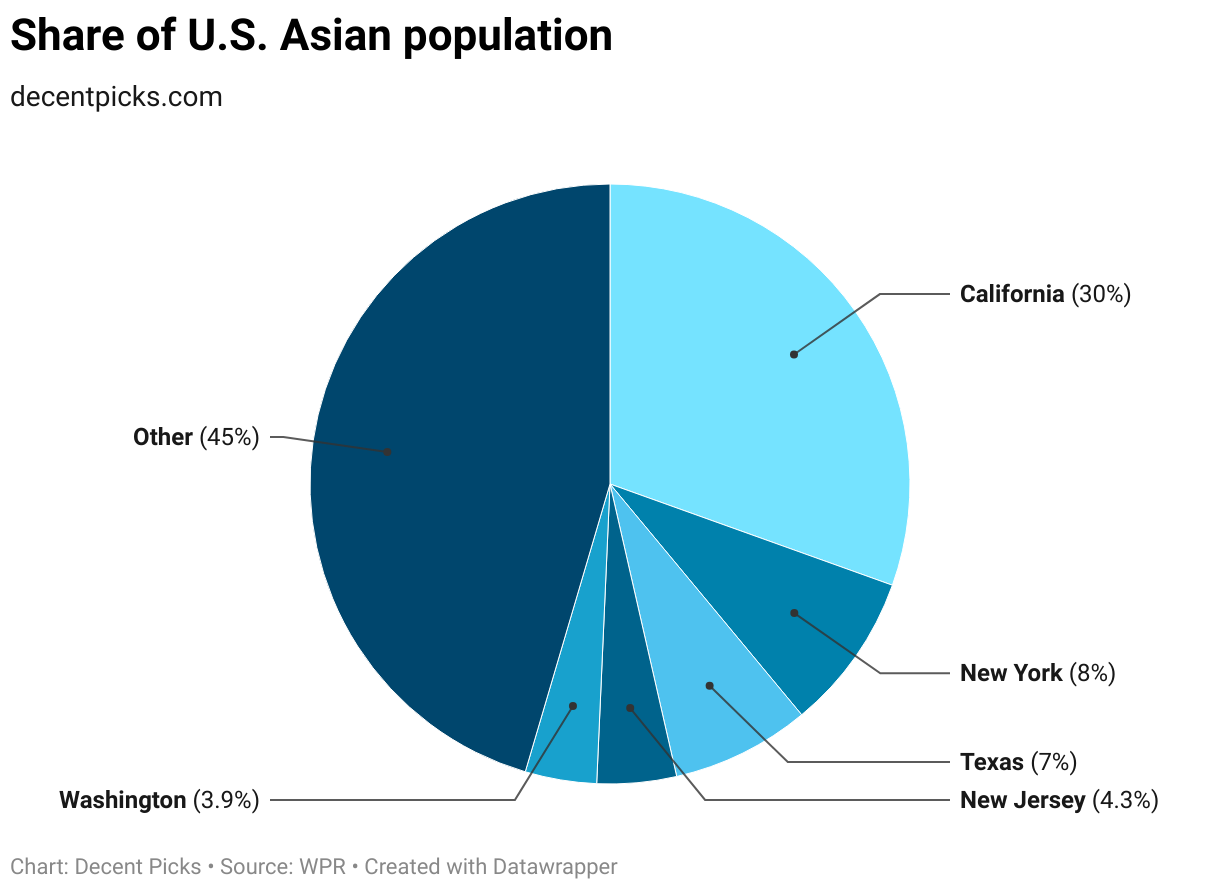
California is home to 30% of the U.S. Asian population, followed by New York, Texas, New Jersey and Washington. Together, the top five states host 55% of Asians in the U.S.
Disclosure: We are an Amazon Associate. Some links on this website are affiliate links, which means we may earn a commission or receive a referral fee when you sign up or make a purchase through those links.
Related Posts
 America’s Most Aged States with the Highest Life Expectancy and Low Fertility Rates
 Countries with the Most Aged Populations

 USCIS Proposes Major Changes to H-1B Visa Process, 8 Key Changes You Should Know
- States with the Highest and Lowest Obesity Rates in the U.S.
- Which States Have the Lowest Sales Tax?
- America’s Popular College Majors and Their Changes Over the Last Decade
- The World’s Wealthiest Countries in 2023
 The U.S. Senators Are Aged


Leave a Reply